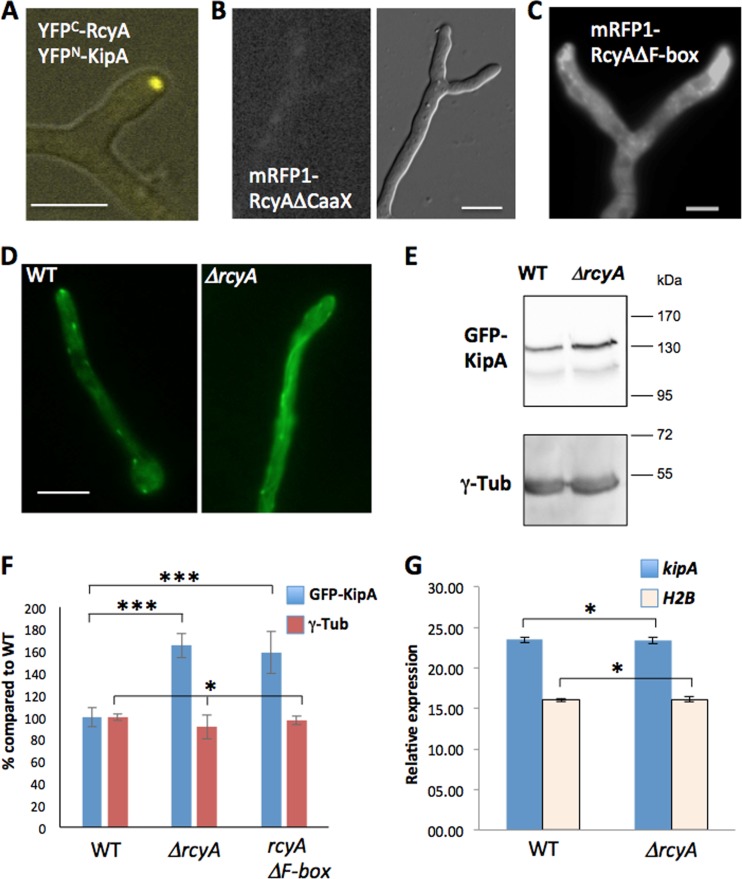
FIG 6.
Effect of rcyA deletion on the KipA concentration. (A) Bimolecular fluorescence complementation of RcyA and KipA. (B and C) Localization of mRFP1-RcyA-deleted CaaX motif (B) and mRFP1-RcyA-deleted F-box (C). (D) Localization of GFP-KipA in the wild-type (SSH27) and SSH43 (ΔrcyA) strains. The microscopy medium was MM plus 2% glycerol. (E) Western blotting of cell lysate, SSH27 (GFP-KipA), SSH43 (GFP-KipA, ΔrcyA), and SSH69 (GFP-KipA, mRFP1-RcyAΔF-box) (strain SSH69 is not shown here), using a polyclonal anti-GFP antibody and a monoclonal anti-gamma-tubulin (γ-Tub) antibody as an internal control for the basal protein amount. (F) Relative levels of GFP-KipA and gamma-tubulin in the Western blotting. The wild-type value was set to 100% (n = 6). *, P > 0.05 (no significant difference); ***, P > 0.001 (highly significant difference). (G) Expression of the kipA gene. The graph represents the relative levels of expression of the kipA gene as measured by RT-PCR. H2B was used as a control. All experiments were done with three biological and two technical replicates. Scale bars represent 5 μm.

