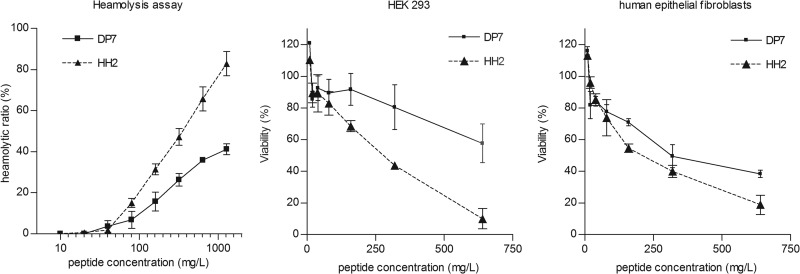
FIG 3.
Hemolytic activity and cytotoxicity of DP7 and HH2. The x coordinate is the concentration of peptides in the 2-fold serial dilution series that started from 1,280 mg/liter (hemolysis assay) or 640 mg/liter (cytotoxicity assay). The y coordinate is the degree of hemolysis relative to the total hemolysis control (hemolysis assay) or the viability of cells (cytotoxicity assay). (left) Release of hemoglobin was monitored to estimate the degree of erythrocyte lysis caused by the peptide. (Middle and right) Living HEK 293 and human epithelial fibroblasts after treatment with peptides were measured using a CCK-8 kit, and viability was calculated relative to the untreated control. All data represent means ± standard deviations from three independent experiments performed in triplicate.

