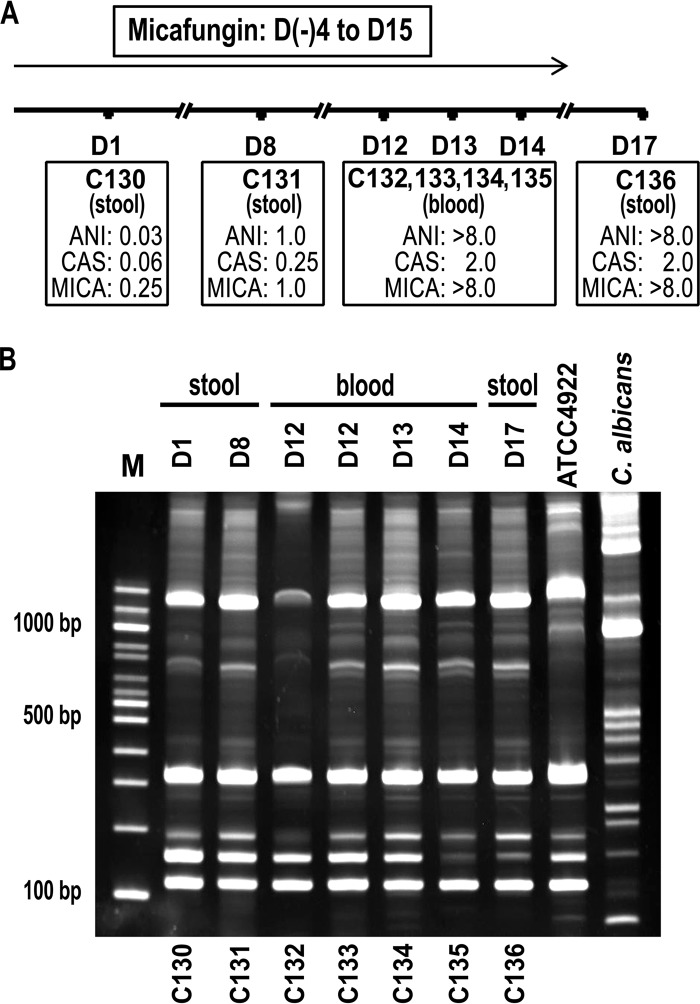
FIG 4.
Genetic analysis of C. kefyr FKS1 HS1 from a series of isolates recovered from a single patient. (A) Time line of sequential C. kefyr isolates. Micafungin was stopped 4 days prior to the last culture. (B) The amplicons generated by Rep-PCR with primers Ca-21 and Ca-22 were separated in a 6% TBE acrylamide gel. The day and source of culture are shown above; strain designations are shown below each lane. A study-independent C. kefyr (ATCC 4922), was included for comparison as was C. albicans (right two lanes, respectively). Isolate C132 produced the same banding pattern from independent Rep-PCRs of genomic DNA replicates. Molecular size markers are shown on the left (lane M). ANI, anidulafungin; CAS, caspofungin; MICA, micafungin.

