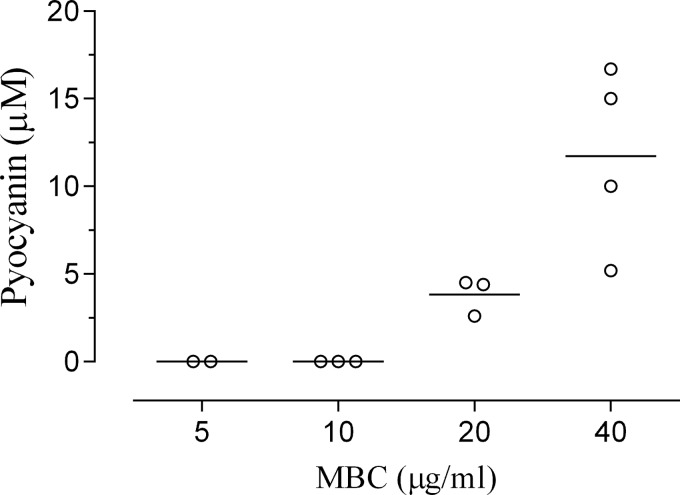
FIG 5.
Correlation of pyocyanin production and Ag+ resistance by clinical isolates. Pyocyanin production by 12 clinical isolates of P. aeruginosa was determined by sequential chloroform extractions with quantitation by spectrophotometry. Suspensions of clinical isolates containing equivalent numbers of CFU were exposed to serial dilutions of AgNO3 (0 to 40 μg/ml) for 24 h. The surviving bacteria were transferred to MHA plates, the number of CFU was counted, and the minimum bactericidal concentration (MBC) was determined. The data were analyzed using the Spearman correlation method (P < 0.0001; correlation coefficient = 0.9456; n = 12). Each symbol represents the value for a clinical isolate of P. aeruginosa, and each bar represents the mean for a group of isolates.

