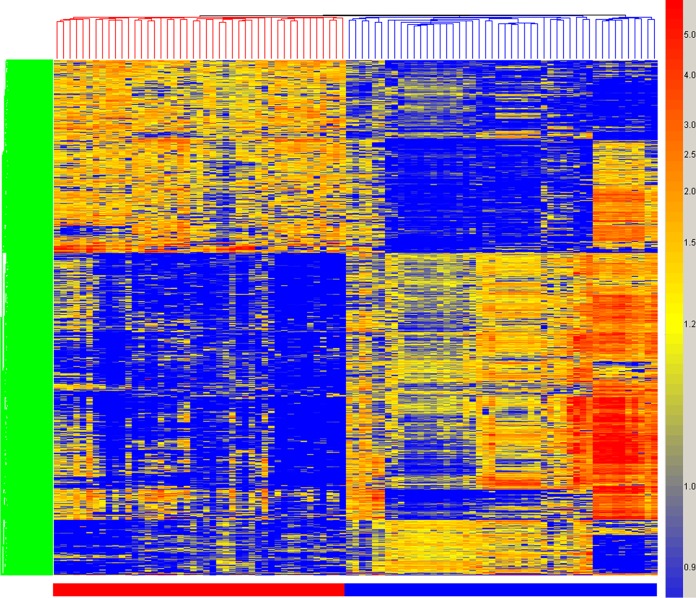
FIG 2.
Hierarchical clustering of valley fever immunosignature. A total of 1,586 peptides from a 1-way ANOVA between VF-infected and uninfected individuals are plotted on the y axis. The coloring is based on the signal intensities obtained from relative binding on the 10,000-peptide array, with blue representing low relative intensity and red representing high signal intensity. Each column represents the immunosignature of one individual, with VF patients (red), uninfected individuals, and pre- and post-influenza vaccine sera (blue).

