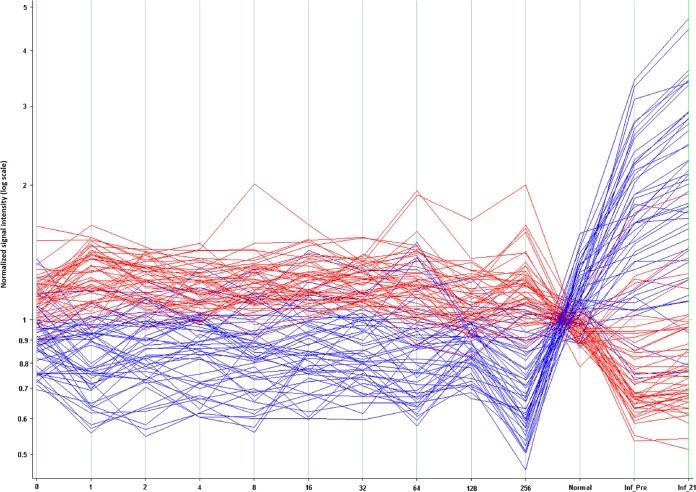
FIG 3.
Signal intensity (y axis) for 96 peptides from the 10,000 peptide microarray that distinguish VF and influenza vaccine recipients. The x axis indicates signal response averaged across patients for each CF titer. On the far right are signals averaged for the influenza vaccine recipients and normal donors. These data originated from the full 10,000-peptide array. Forty-eight peptides that captured high antibody binding in VF patients and low signals in normal/influenza vaccine recipients are colored in red. Forty-eight peptides showing higher signals in normal/influenza vaccine recipients and low signals for VF patients are colored in blue. Consistency was seen across the valley fever patients, and a reversal in signal was seen for non-VF patients. Inf_Pre, influenza vaccine recipients; Inf_21, patients 21 days postvaccine.

