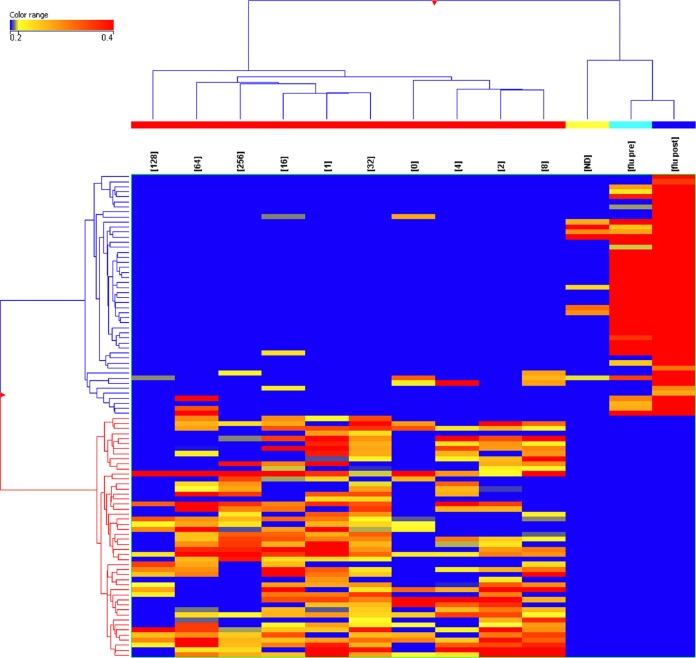
FIG 4.
Heat map showing normalized average signals from the 96 predictor peptides as in Fig. 2 but displaying the cohort separation. The data were averaged per CF titer and for 45 VF patients (red bars), 34 healthy controls (yellow bar), 7 pre-2006 influenza vaccine recipients (cyan bar) (flu pre), and 21-day postvaccine patients (dark blue bar) (flu post) (x axis). A t test identified 96 peptides (y axis) as being highly significant for distinguishing VF and healthy donors (ND).

