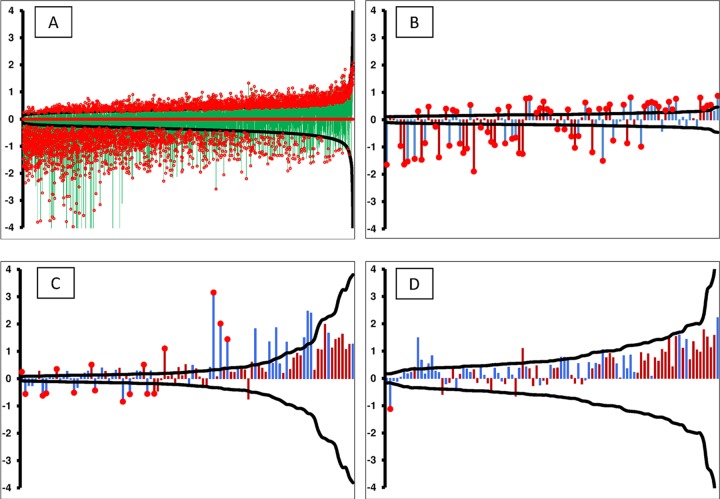
FIG 5.
Limits of detection graphed from a post hoc power calculation. The black curve in each figure represents the ±delta (minimum detectable fold change) calculated from the statistical precision of each peptide independently. The probes along the x axis are sorted by the calculated power, thus forming a smooth curve. Delta was calculated using α as 1/number of peptides/microarray, β of 0.20, and n of number of patients per group. The vertical bars (y axis) represent the log2 ratio between the healthy and VF-infected patients, with red bars indicating a peptide selected to predict VF and blue bars representing peptides selected for detection of non-VF conditions. The red circles on top of certain bars specify statistically significant fold changes at a P value of <0.01. The peptides used were 10,440 random peptides (training data set) using VF and healthy controls (A), 96 VF predictor peptides (training data set) within the 10,000 microarray (B), 96 resynthesized VF predictor peptides (training data set) for the VF-diagnostic assay (C), and 96 resynthesized VF predictor peptides (test data set) for the VF-diagnostic assay (D).

