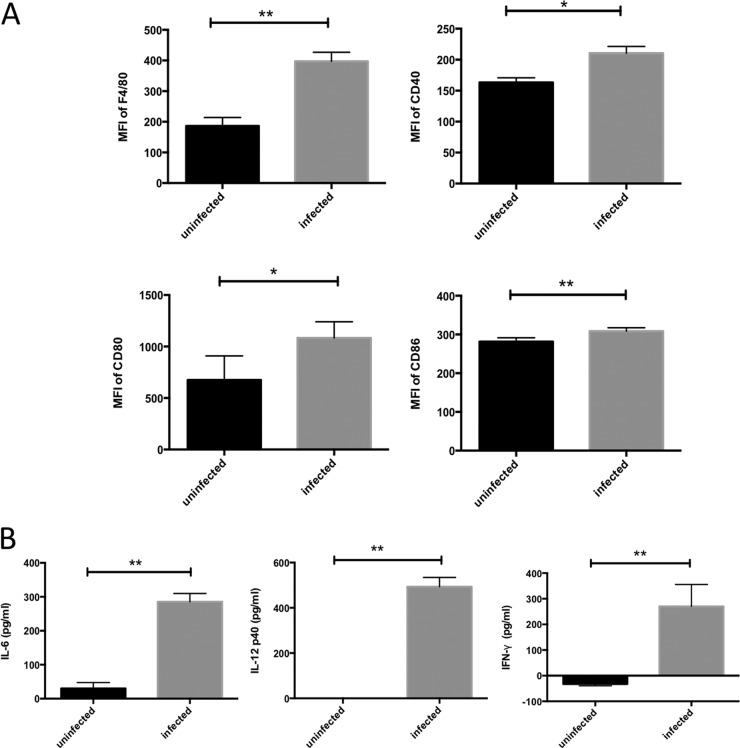
FIG 1.
Activation of macrophages exposed to N. caninum tachyzoites. (A) Macrophage activation was assessed by examining surface expression of F4/80, CD40, CD80, and CD86. The mean fluorescence intensity (MFI) of stained cells for each marker is shown. (B) IL-6, IL-12p40, and IFN-γ levels were measured by ELISA. Each bar represents the mean ± SD (n = 4), and significant differences were determined with Student's t test (*, P < 0.05; **, P < 0.01). Data are representative of results from three (A) or two (B) independent experiments.

