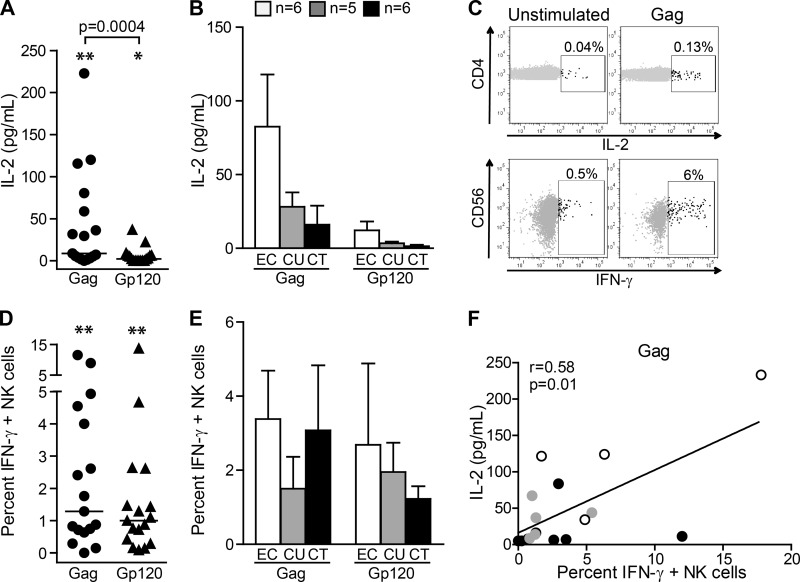
FIG 1.
Increased production of IFN-γ by NK cells correlates with IL-2 production in response to HIV-1 Gag. (A) Quantification of IL-2 in the supernatant after 20 h of incubation of PBMCs in the presence of HIV-1 Gp120- or Gag-derived peptides in 17 HIV-infected individuals, including 6 with chronic ART-treated infection, 5 with untreated progressive infection, and 6 elite controllers. P < 0.05 (*) and P < 0.005 (**) compared to unstimulated PBMCs. (B) Each bar represents the mean ± SEM concentration of IL-2 in the supernatant for each cohort after stimulation with the indicated peptides. (C) Flow cytometry panels show representative examples of IL-2 production by HIV-1-specific CD4+ T cells (upper row) and IFN-γ production by NK cells (lower row) after intracellular staining. (D) Percentages of IFN-γ+ NK cells after 20 h of incubation of PBMCs in the presence of the indicated HIV-1-derived peptides. **, P < 0.005 compared with unstimulated PBMCs. (E) Each bar represents the mean ± SEM IFN-γ+ NK cell percentages for each cohort after stimulation with the indicated peptides. (F) Positive correlation between the concentration of IL-2 in the supernatant and the percentages of IFN-γ+ NK cells after 20 h of incubation of PBMCs in the presence of Gag peptides (Spearman's rank correlation test). Data are reported after background subtraction. Horizontal lines indicate the medians. Statistical differences with P < 0.05 are indicated and were determined using the nonparametric Wilcoxon signed-rank test.

