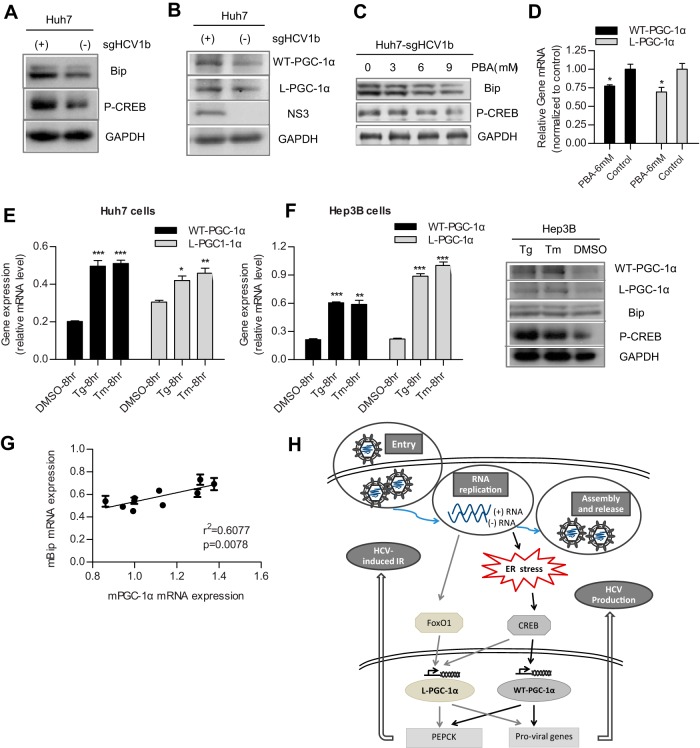
FIG 7.
HCV RNA replication upregulates WT-PGC-1α/L-PGC-1α through ER stress in Huh7 cells, and hepatic mPGC-1α correlates with ER stress marker mBip in mice. (A) The activation of ER stress and CREB is indicated by the high expression levels of Bip and phospho-CREB (P-CREB) in Huh7-sgJFH1b cells, respectively. (B) Western blot analysis for detecting the expression of WT-PGC-1α and L-PGC-1α in Huh7-sgJFH1b cells and in Huh7 cells. (C) Effect of PBA on the protein levels of Bip and phospho-CREB (P-CREB) in Huh7-sgJFH1b cells. (D) Effect of PBA on the HCV-induced WT-PGC-1α/L-PGC-1α mRNA upregulation in Huh7-sgJFH1b cells. (E) Effect of Tg and Tm on WT-PGC-1α/L-PGC-1α mRNA levels in Huh7 cells. (F) Effects of Tg and Tm on WT-PGC-1α/L-PGC-1α elevation in Hep3B cells. Left, effects of Tg and Tm on WT-PGC-1α/L-PGC-1α mRNA levels in Hep3B cells; right, Western blot analysis for detecting the protein levels of Bip, phospho-CREB (P-CREB), and both WT-PGC-1α and L-PGC-1α in Hep3B cells with Tg and Tm treatment. For panels D to F, results are presented as means ± SEMs of triplicate measurements. (G) Correlation of hepatic mPGC-1α and mBip transcript levels in Leprdb/db mice (individual dot represents one mouse; results are presented as means ± SEMs of triplicate measurements; n = 10). (H) A proposed model of the dual effects of WT-PGC-1α/L-PGC-1α in HCV-induced insulin resistance and HCV production, and the mechanism by which HCV upregulates WT-PGC-1α/L-PGC-1α. Gray and black solid arrows represent the signaling pathways by which HCV upregulates L-PGC-1α and WT-PGC-1α, respectively. HCV RNA replication induces ER stress, which further phosphorylates CREB to activate both WT-PGC-1α and L-PGC-1α transcription. L-PGC-1α transcription is also elevated by HCV infection-induced FoxO1 dephosphorylation, which is independent of ER stress. The increased levels of WT-PGC-1α and L-PGC-1α promote expression of PEPCK and proviral genes. The increased PEPCK expression could account for HCV-induced IR, and the increased proviral gene expression promotes HCV production. For panels D to F, P values are as follows: *, P < 0.05; **, P < 0.01; and ***, P < 0.001 (all determined by Student's t test).

