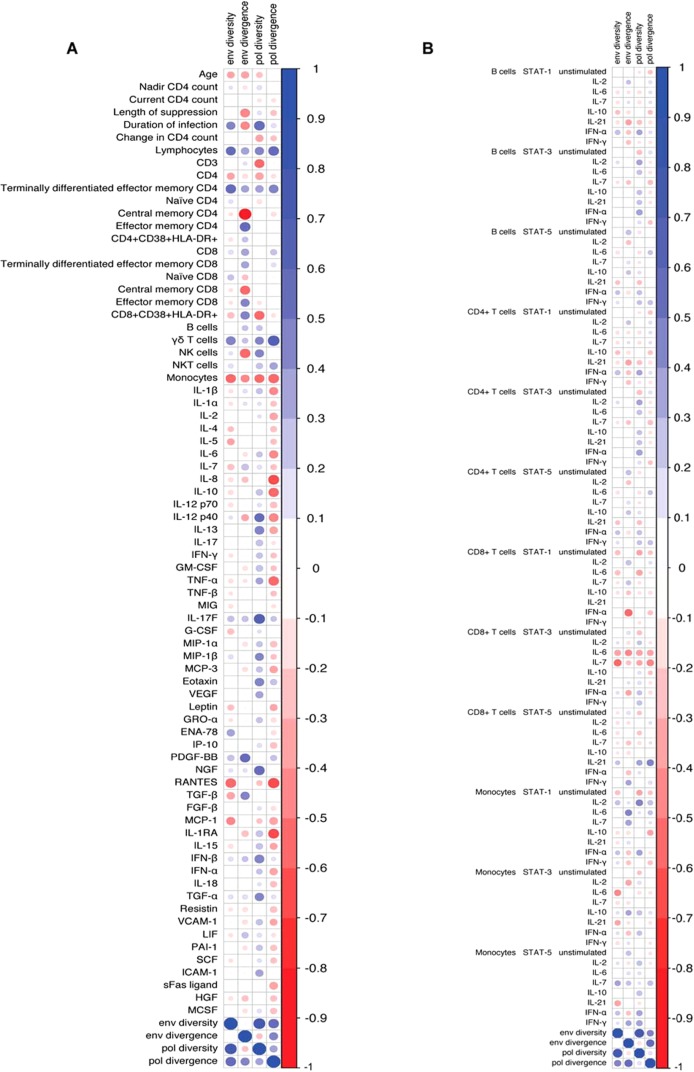
FIG 3.
Correlation matrices of proviral characteristics and immune characteristics. The colored circles represent the Spearman's correlation coefficient, sized according the magnitude of the coefficient and colored according to the scale bar shown on the right. Positive correlations are blue and negative are red, and the size denotes the magnitude of the correlation. (A) Correlation matrix of proviral characteristics and cellular markers and plasma cytokine levels; (B) correlation matrix of proviral characteristics and signaling markers.

