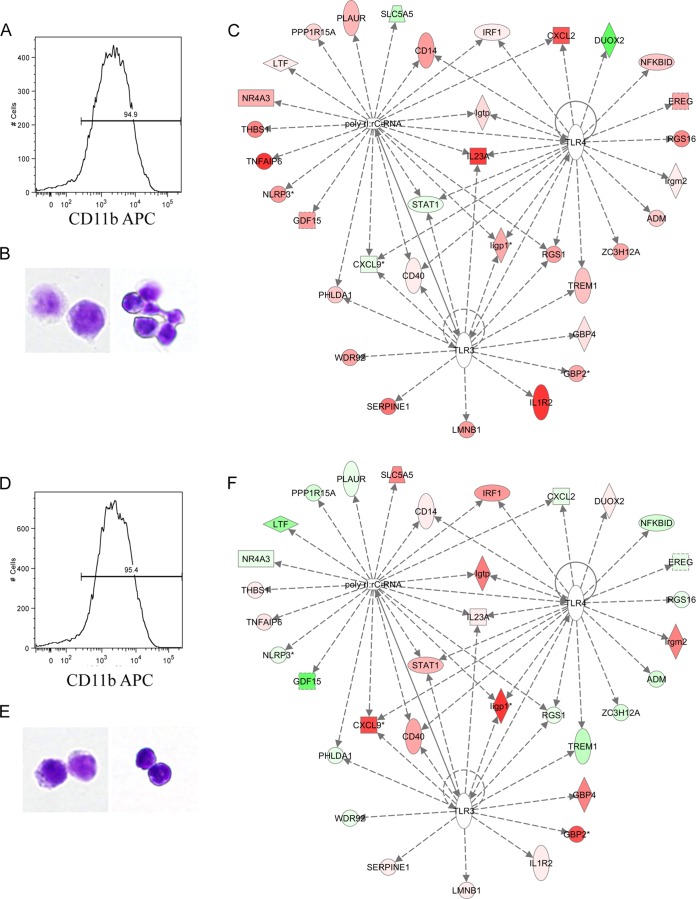
FIG 10.
Pathway analysis of the gene-to-gene networks of TLR3, TLR4, and poly(I·C) in mice immunized with UV-V after SARS-CoV challenge. Direct comparison of gene expression profiles in CD11b+ cells isolated from the lungs of UV-V- and UV-V+TLR-immunized mice. (A and D) FACS analysis of enriched populations of CD11b+ lung cells in UV-V-immunized (A) or UV-V+TLR-immunized (D) mice. Cells were prepared as described in Materials and Methods. (B and E) Conventional Giemsa staining of cytospins from populations of CD11b+ lung cells in UV-V-immunized (B) or UV-V+TLR-immunized (E) mice (magnification, ×100). (C and F) Diagram showing the pathways of TLR3 and TLR4 signaling. Genes shown in red were upregulated, and those in green were downregulated. Several genes downstream of TLR3 and TLR4 signaling were upregulated in UV-V-immunized mice (C) compared with expression in UV-V+TLR-immunized mice (F). We overlaid gene expression data on the formed network by using Ingenuity Pathway Analysis software.

