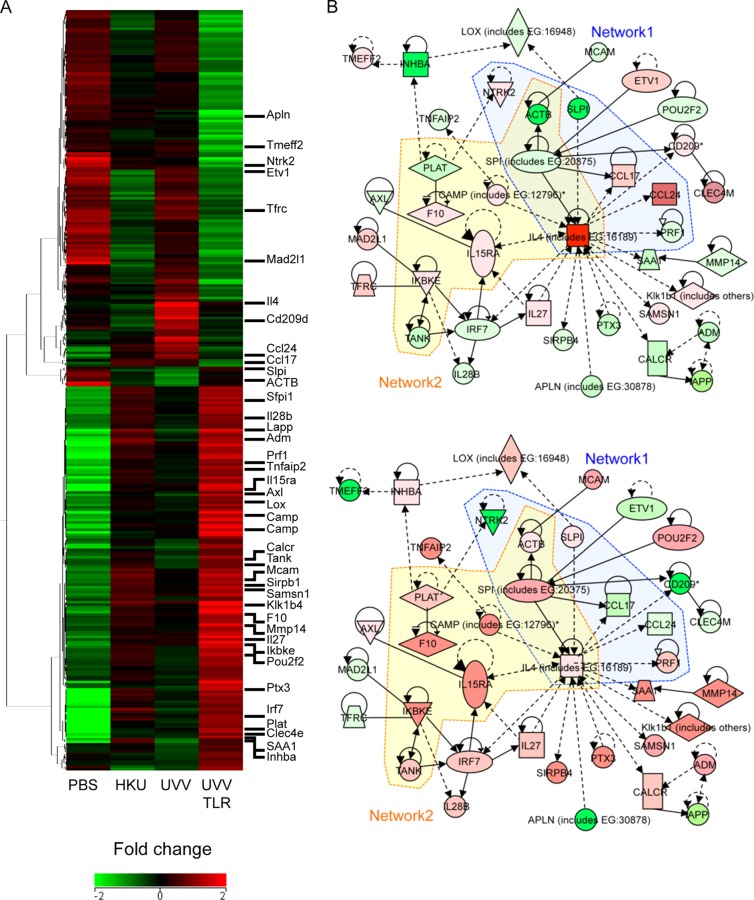
FIG 8.
Global gene expression profiles of mice immunized with UV-V after SARS-CoV challenge. An ANOVA was performed to assess differences among all groups. All genes with a greater than 2.0-fold change (P < 0.05) in expression, relative to the median of the unchallenged groups, are depicted. Each row represents the lungs of a group of mice (n = 3, mock immunization with PBS (PBS); n = 6, inoculation with HKU39849 isolate (HKU), UV-V (UVV) or UV-V+TLR (UVVTLR)). The heat map shows the relative levels of expression of 305 probes (242 genes), confirmed statistically by direct comparisons between the UV-V and UV-V+TLR groups. The heat map was generated using the software program GeneSpring GX 12.1. (A) Uncentered Pearson correlation was used as the distance metric with average linkage for unsupervised hierarchical clustering. In the heat map, red represents high expression, black represents median expression, and green represents low expression. The color scale bar at the bottom indicates the relative level of expression. The sidebar on the right indicates genes that are closely related to each other. (B) A gene interaction network including 39 genes was constructed from 242 genes connected by IPA software. The solid and dotted lines indicate direct and indirect interactions, respectively. Genes shown in red were upregulated, and those shown in green were downregulated, compared with the PBS group. The central node is IL-4, a key cytokine in inflammation associated with eosinophils. Network 1 was composed of genes associated with eosinophilia. Network 2 was composed of genes associated with “inflammation of the lungs.” The same network is shown for UV-V-immunized (upper panel) and UV-V+TLR-immunized (lower panel) mice.

