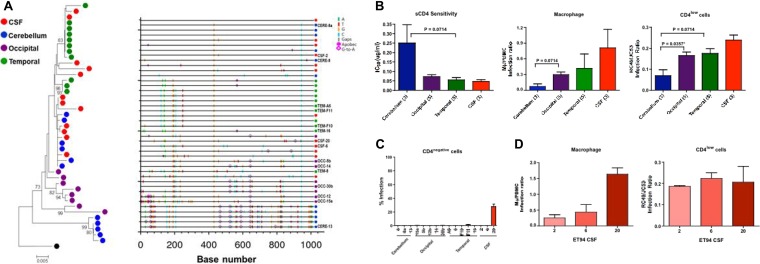
FIG 3.
ET94 Env analysis. (A) Phylogenetic tree and Highlighter plot analyses of the env sequences from the CSF, cerebellum, and occipital and temporal regions of ET94. A neighbor-joining tree of the env V1-to-V5 region rooted to HIV-1SF162 is shown, with bootstrap values of >70% indicated at the appropriate nodes. All sequences were obtained by SGA, and the genetic distance, representing the number of nucleotide substitutions per site between env sequences, is scaled at the bottom (0.005). A Highlighter plot was generated at www.hiv.lanl.gov, and the sequence identifiers for the Env clones used in functional studies are indicated on the y axis. The positions of nucleotide base transitions and transversions in the Highlighter plots are indicated by short colored-coded bars. Tics that are bracketed represent G-to-A changes, while those in circles represent G-to-A changes in a sequence consistent with an APOBEC signature. (B and C) sCD4 sensitivity and infection of primary macrophages and CD4low (B) and CD4-negative (C) cells of pseudoviruses expressing Envs from the different brain regions and the CSF compartment. (B)The numbers in parentheses indicate the number of clones analyzed per compartment. (C) The level of infection of CD4-negative cells is expressed as a percentage of that of cells expressing both CD4 and CCR5. P values by Mann-Whitney t tests that approach significance (<0.1) are shown, with asterisks indicating those that reached statistical significance (P < 0.05). (D) Comparison of the abilities of the three individual CSF Env clones of ET94 to mediate infection of primary macrophages and CD4low cells. The error bars in panels B, C, and D indicate means and standard deviations (SD) of 2 or 3 independent experiments.

