
FIG 5.
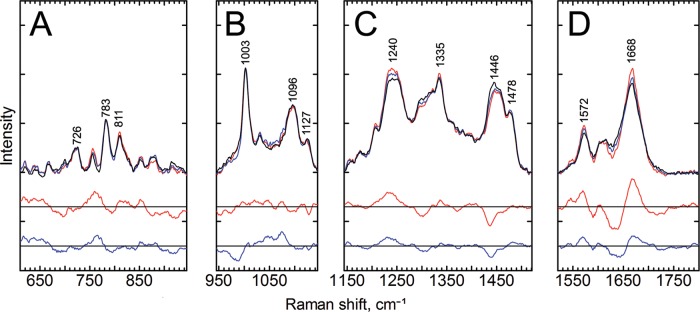
Raman spectra of aqueous EV1 particles at room temperature. The top lines show the Raman spectra of intact EV1 (RT, black line), intermediate particles (50°C, blue line), and disrupted particles (60°C, red line). Below are the 2-fold-magnified difference spectra corresponding to the temperature intervals between 60°C and RT (red) and between 50°C and RT (blue). The spectra were divided into individual sections and normalized to the mean signals of each section, and the baselines were shifted for better visualization. (A) 610 to 945 cm−1; (B) 945 to 1,245 cm−1; (C) 1,245 to 1,520 cm−1; (D) 1,520 to 1,800 cm−1. Marked vibrations from lower to higher frequency are as follows: 726 cm−1, RNA; 783 cm−1, RNA; 811 cm−1, RNA phosphate symmetric stretching, an A-form RNA helix marker; 1,003 cm−1, Phe; 1,096 cm−1, a complex region of CC and CH vibrations of lipid, RNA, and protein capsid; 1,127 cm−1, nonaromatic amino acids and lipids; 1,240 cm−1, Am III; 1,335 cm−1, RNA bases; 1,446 cm−1, C-H vibrations from the proteins; 1,478 cm−1, RNA bases; 1,572 cm−1, Trp/RNA; 1,668 cm−1, Am I, revealing information about the secondary structure of the proteins. Data acquisition was performed as described for Fig. 4, and the spectra represent mean signals of measurements from three different EV1 batches, all with a concentration of about 3.8 mg ml−1.