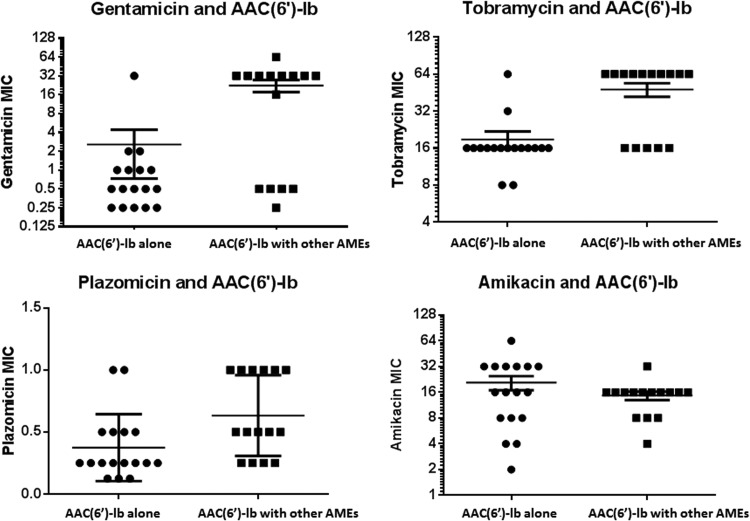
FIG 3.
Distribution of aminoglycoside MICs according to the presence or absence of additional AMEs [ANT(2″)-Ib, AAC(3)-IV, or APH(3′)-Ia] on the AAC(6′)-Ib backbone. The horizontal lines represent the mean MIC ± standard error. Note that the combination of AAC(6′)-Ib and ≥1 other AME was associated with significantly higher MICs of gentamicin (P = 0.01), tobramycin (P = 0.0008), and plazomicin (P = 0.046) but not amikacin (P = 0.31).

