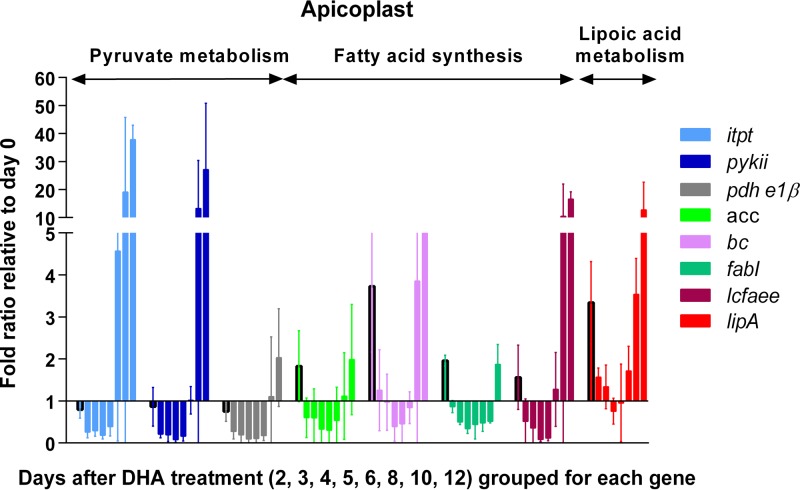
FIG 4.
Transcription levels of 8 genes encoding enzymes of apicoplast pyruvate metabolism and fatty acid synthesis pathways in DHA-treated rings relative to pretreatment rings (fold ratio ± 95% confidence intervals). Relative transcription levels measured for each of the 8 genes are represented with different color bars. For each gene, relative transcription levels measured on days 2 (outlined in black), 3, 4, 5, 6, 8, 10, and 12 post-DHA treatment are grouped together from left to right. The transcription level measured on day 0 (pretreatment) is set as 1 for each gene. Data (means with 95% confidence intervals) were obtained from the results determined for samples in triplicate and three independent experiments. Note: lcfaee could also be active in the endoplasmic reticulum.

