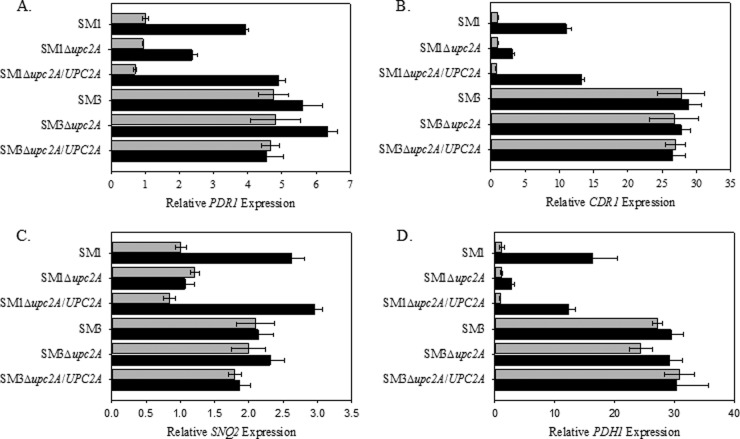
FIG 4.
Effect of UPC2A disruption on constitutive and fluconazole-induced gene expression. RNA was isolated from mid-log-phase cultures of parent clinical isolates, Δupc2A mutants, and revertants, and qRT-PCR analysis of relative gene expression was performed. Light bars represent untreated controls and dark bars represent treatment with 32 μg/ml of fluconazole for 3 h. (A) PDR1; (B) CDR1; (C) SNQ2; (D) PDH1. Data are shown as means ± SEs (n = 3).

