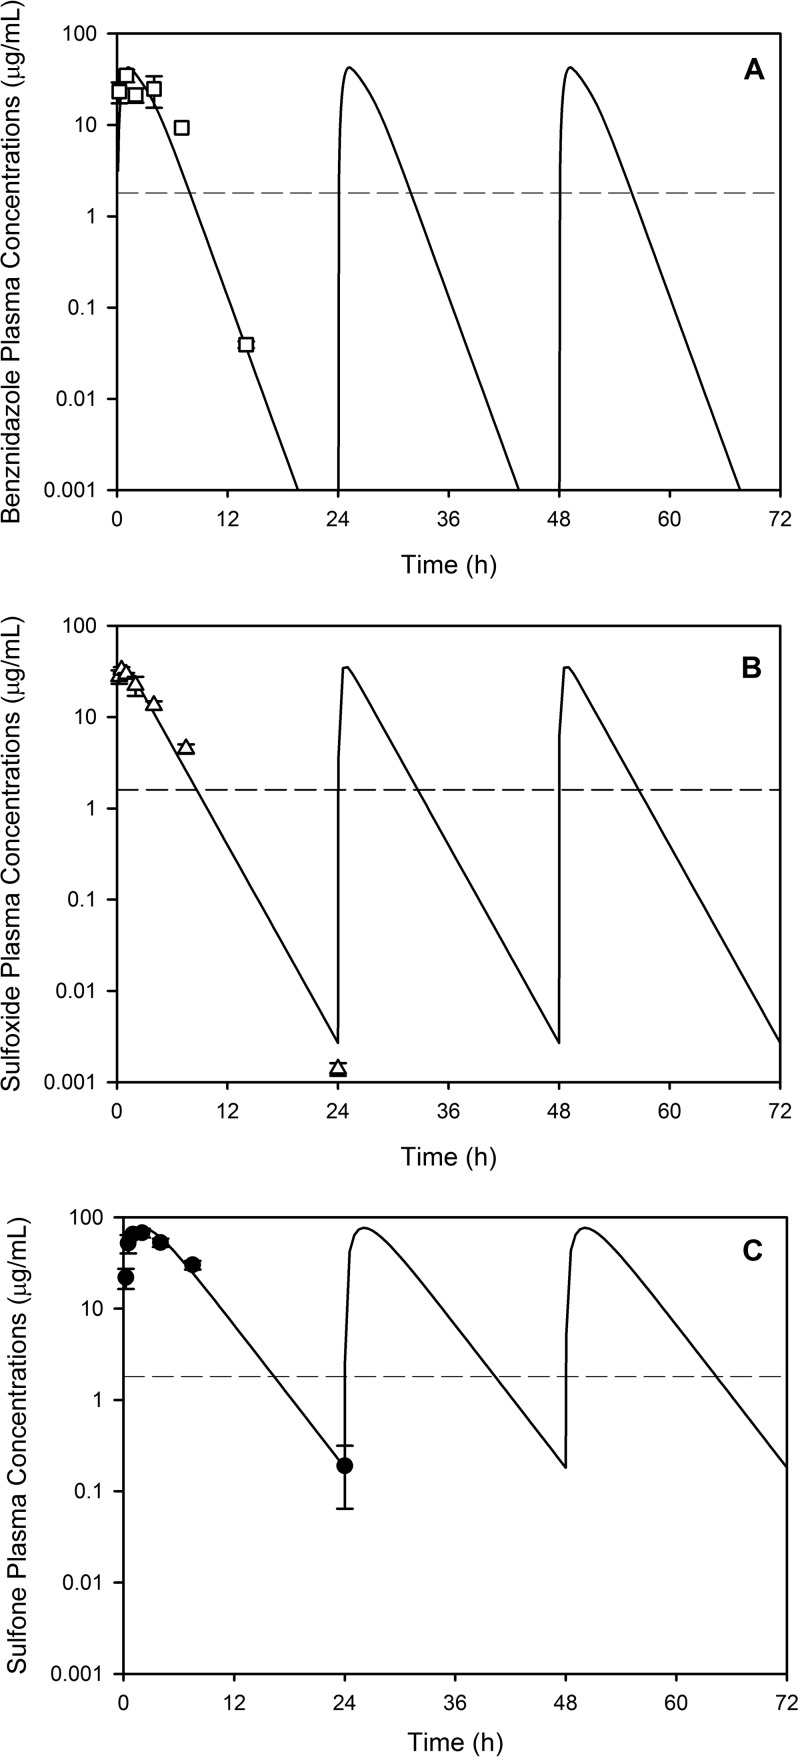
FIG 7.
Simulated plasma concentration-time profiles following repeated once-daily administration of 100 mg/kg benznidazole (A), fexinidazole sulfoxide (B), or fexinidazole sulfone (C) to mice. For ease of interpretation, only the first 3 days of the 20-day dosing regimen are shown. Symbols represent the experimental data, and lines represent the repeated-dose simulated profiles. Dashed lines indicate the in vitro IC50 for each compound.

