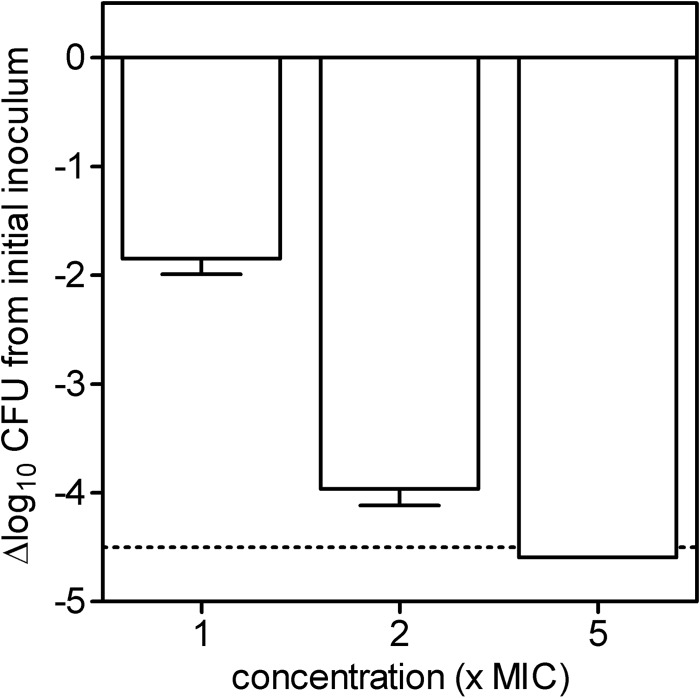
FIG 2.
Bacterial killing of P. aeruginosa ATCC 27853 by 3′,6-diNn at different concentrations expressed as the multiple of the MIC. The ordinate shows the change in the number of CFU (log scale) per milliliter. The solid horizontal line corresponds to a bacteriostatic effect (no change from the initial inoculum), and the dotted horizontal line shows the limit of detection (4.5-log-CFU decrease). Values are means ± standard deviations (n = 3); when not visible, error bars are smaller than the symbols.

