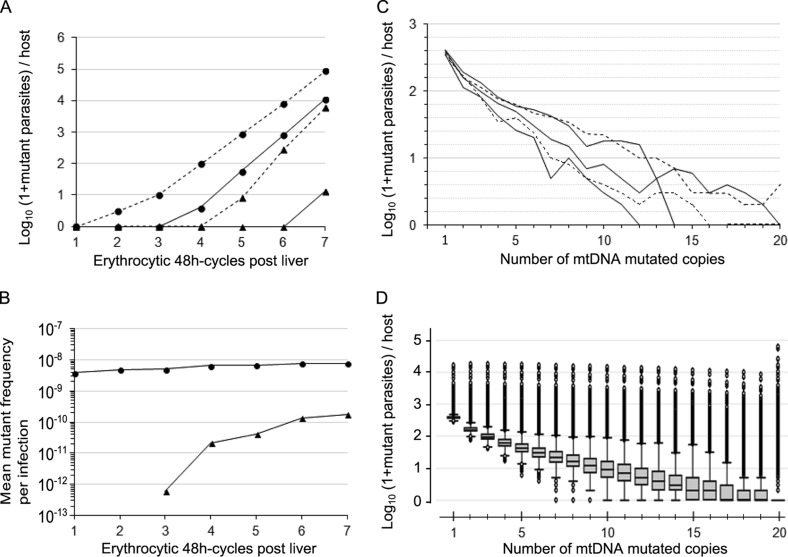
FIG 1.
Dynamics and loads of mtDNA mutant parasites per human host. The data are from 20,000 simulations, with one simulation representing one human infection. (A) Triangles represent homoplasmic-mutant parasites, and circles represent all-mutants (either heteroplasmic or homoplasmic-mutant); plain and dashed lines represent the median and the 99.5th upper percentile, respectively. (B) Triangles and circles represent homoplasmic-mutant and all-mutant parasites, respectively. (C and D) Data are from simulations stopped at the sixth erythrocytic 48-h cycle following parasite delivery from the liver (corresponding to a mean total parasite load per host of 1.5 × 10¹¹). The load of mutant parasites per host is shown, according to the number of mtDNA mutant copies per parasite. In panel C, each line (either plain or dashed) represents one simulated infected host randomly chosen among 20,000 simulations. Five simulations are shown. In panel D, box plots show the medians and interquartile ranges (IQR), and the bottom and top whiskers show the lowest data still within the lower quartile minus 1.5 times the IQR (1.5×IQR) and the highest data still within the upper quartile plus 1.5×IQR, respectively. Outlier values are shown as dots. There is no mutation cost, the mtDNA copy number is 20, and the mutation rate is 10−10/nucleotide/replication for all of the simulations presented here.

