
FIG 5.
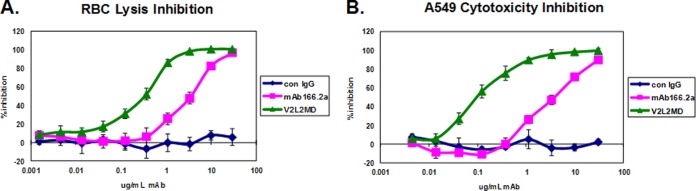
Comparison of in vitro inhibition of T3SS by V2L2MD and MAb166.2a IgG. (A) Rabbit red blood cells (RBC) were incubated with log-phase P. aeruginosa strain 6077 in the presence of the indicated concentrations of purified IgG. The released hemoglobin in the reaction mixture supernatants was measured spectrophotometrically. The percent inhibition was determined by comparing the OD values from the test wells to the OD value in the control wells, which received no IgG. (B) A549 cells were incubated with log-phase P. aeruginosa strain 6077 in the presence of the indicated concentrations of purified IgG. LDH activity released from lysed cells was quantified. The percent inhibition was determined by comparing the values from the test wells to the value in the control wells, which received no IgG. Each data point represents the average of 4 replicates. The IC50s were determined by nonlinear curve fitting. Differences in the IC50s for V2L2MD and MAb166.2a in both assays were determined to be significant (P < 0.05) by unpaired t test. Error bars represent the standard deviations for four replicate samples.