FIG 1.
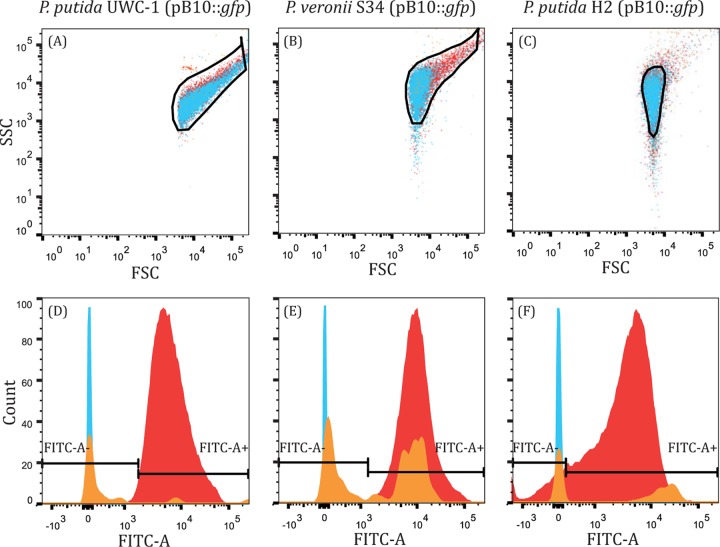
FCM scatter SSC/FSC profiles (A to C) and population count histograms (D to F) clearly showing the plasmid-bearing fluorescent (FITC-A+) (red, right side in panels D to F) and plasmid-free nonfluorescent fractions (FITC-A−) (blue, left side in panels D to F), as well as control populations of P. putida UWC-1, P. veronii S34, and P. putida H2. Initial SSC-FSC gates (black lines) were set using plasmid-containing and plasmid-free control populations as well as a blank sample (orange) to exclude background events. The populations then were further gated on FITC-A such that 99.5% of the plasmid-containing population was FITC-A positive (P. putida UWC-1 and P. veronii S34) or to best discriminate between the plasmid-containing and -free populations (P. putida H2). Thus, the SSC-FSC profiles and histograms for each strain are composites representing individual populations of plasmid-containing (red) and plasmid-free cells (blue) as well as a blank sample (orange).

