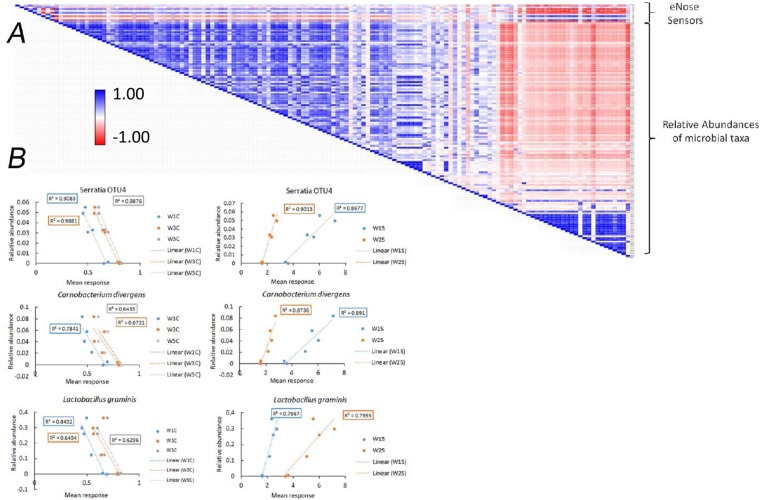
FIG 10.
Association of eNose sensor responses and relative of individual taxa. (A) Correlation matrix (R values) of the relative abundances of microbial taxa measured by pyrosequencing and the responses of individual eNose sensors. The color scale on the left and the positions of the eNose rows and rows of taxa are indicated on the right. (B) Dot plots of the relative abundances of specific taxa and responses of individual eNose sensors in untreated sausage samples. The correlation coefficients (R2 values) are highlighted by color-coded boxes that correspond to regression lines and data points from each sensor.

