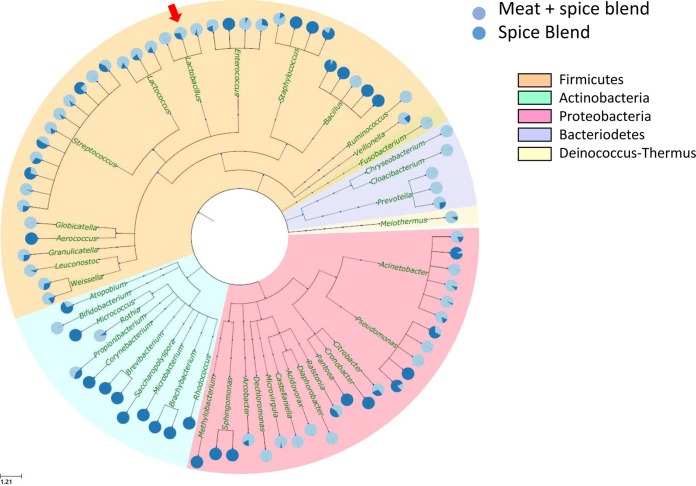
FIG 11.
Source-tracking taxa from the pork sausage and its spice blend ingredient. The distribution of taxa is illustrated from the day 0 sample of the untreated pork sausage and from a sample of the spice blend mix that was used to develop the model pork sausage. The dendrogram was developed from representative sequences derived from each of the 82 different genera that were detected in the samples. Representative sequences were developed from each of the genus-level Multi-CLASSIFIER taxonomic bins by first collapsing to 97% identity using cmALIGN and then aligning it to a phylogenetic framework established from 16S reference sequences. The individual pie charts depict species-level OTU for each of the 82 genera and the relative abundance of each OTU in the spice blend (dark blue) or the meat-spice blend (light blue) is illustrated by the proportion in each pie.

