
FIG 2.
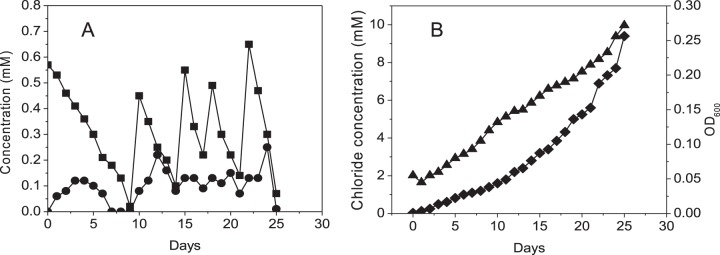
Growth of P. putida MC4-5222 on TCP. Panels A and B represent data from the same culture. TCP was repeatedly added to a total concentration of 3.1 mM. Symbols: ▲, optical density at 600 nm; ◼, TCP; ●, DCP; ◆, chloride.
Official websites use .gov
A
.gov website belongs to an official
government organization in the United States.
Secure .gov websites use HTTPS
A lock (
) or https:// means you've safely
connected to the .gov website. Share sensitive
information only on official, secure websites.
Growth of P. putida MC4-5222 on TCP. Panels A and B represent data from the same culture. TCP was repeatedly added to a total concentration of 3.1 mM. Symbols: ▲, optical density at 600 nm; ◼, TCP; ●, DCP; ◆, chloride.