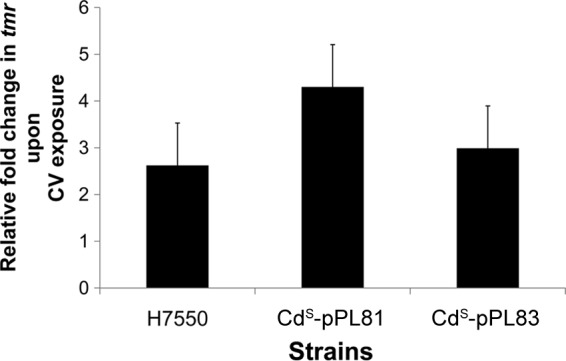
FIG 5.

Relative increase in tmr transcript levels upon exposure to CV (15 μg/ml) in H7550 and H7550-CdS derivatives. Quantification of tmr transcripts was performed using qRT-PCR as described in Materials and Methods. The tmr transcript levels were first normalized to those of spoVG from the same treatments. These normalized tmr transcript levels were used to calculate the relative fold increase in tmr upon exposure to CV (15 μg/ml). These data were computed from three independent trials.
