FIG 3.
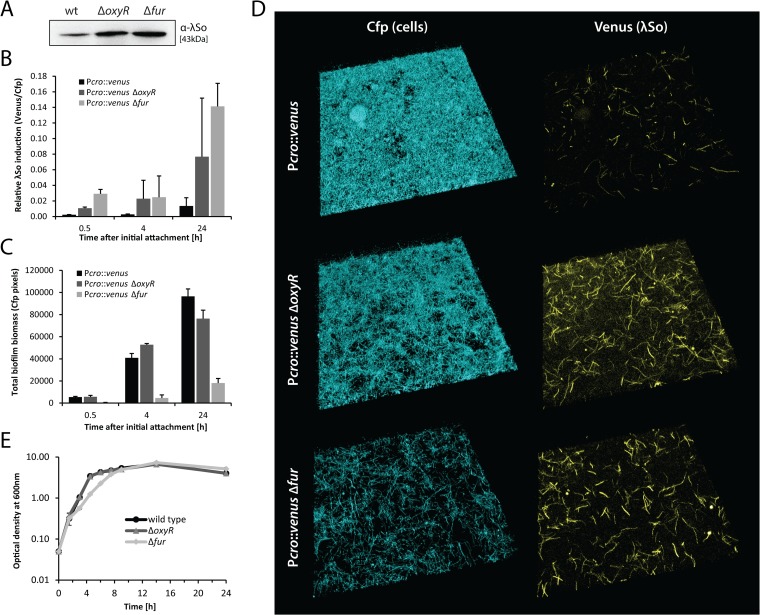
Regulation by OxyR and Fur affects λSo prophage induction and biofilm development. (A) Detection of phage λSo by immunoblot analysis in biofilms formed by the wild type, the ΔoxyR deletion mutant, and the Δfur deletion mutant under static conditions in petri dishes. Sample normalization was achieved by adjusting cell suspensions to the same OD600 and analysis of stained SDS-PAGE gels (see Fig. S2 in the supplemental material). Representative immunoblot patterns from at least two independent experiments are presented. (B) Relative induction of λSo prophage over time in biofilms formed by strains Pλcro::venus (black), Pλcro::venus ΔoxyR (dark gray), and Pλcro::venus Δfur (light gray) under hydrodynamic conditions in flow cells. Bars represent the mean values of Venus/Cfp ratios, with standard deviations displayed as error bars, obtained from two independent experiments conducted at least in duplicate. (C) Accumulation of biofilm biomass (Cfp signal) over time of strains Pλcro::venus, Pλcro::venus ΔoxyR, and Pλcro::venus Δfur under hydrodynamic conditions in flow cells. Bars represent the mean values of total Cfp pixel values, with standard deviations displayed as error bars, obtained from two independent experiments conducted at least in duplicate. (D) CLSM images of 24-h-old biofilms formed by strains Pλcro::venus, Pλcro::venus ΔoxyR, and Pλcro::venus Δfur under hydrodynamic conditions in flow cells. Cfp fluorescence represents all cells, and Venus fluorescence indicates λSo prophage induction. (E) Planktonic growth of S. oneidensis MR-1 wild type, the ΔoxyR deletion mutant, and the Δfur deletion mutant in LB medium under aerobic conditions. Growth curves are derived from one representative experiment conducted in triplicate. Error bars represent standard deviations.

