FIG 5.
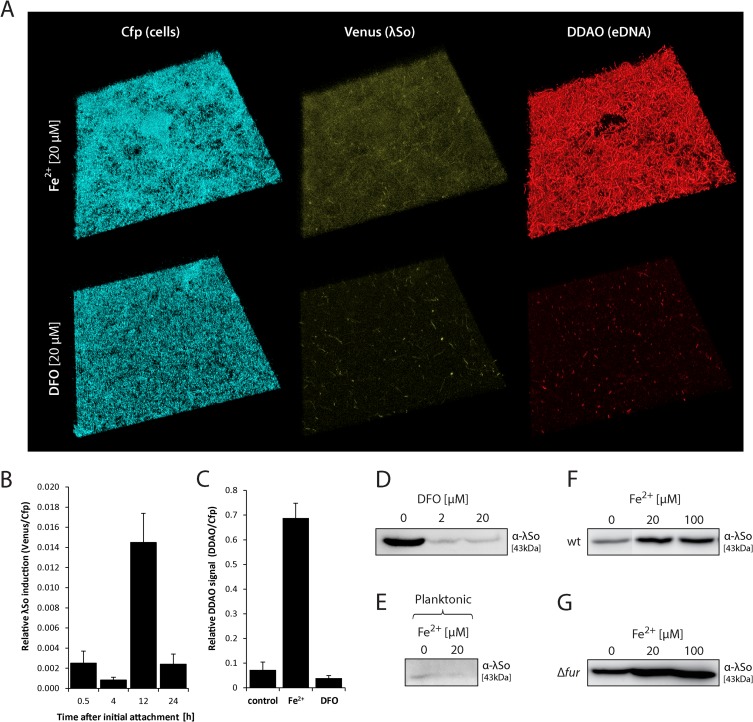
Iron controls the level and timing of λSo prophage induction and eDNA release. (A) CLSM image projections of 24-h-old biofilms formed by strain Pλcro::venus under hydrodynamic conditions in flow cells in the presence of 20 μM FeCl2 (Fe2+) or 20 μM iron chelator desferrioxamine (DFO). Cfp fluorescence represents all cells, and Venus fluorescence indicates λSo prophage induction. The biofilms were stained with DDAO to visualize eDNA. The lateral edge of each micrograph is 250 μm. (B) Relative induction of λSo prophage over time in biofilms formed by strain Pλcro::venus under hydrodynamic conditions in flow cells in the presence of 20 μM Fe2+. Total Venus signal intensities from CLSM images were normalized to total Cfp signal intensities to obtain an induction-to-biomass ratio. Black bars represent the mean values with standard deviations displayed as error bars, obtained from two independent experiments conducted at least in duplicates. (C) eDNA levels as a measure of relative DDAO fluorescence in biofilms formed under hydrodynamic conditions in flow cells in the presence of 20 μM Fe2+ or 20 μM iron chelator DFO. Total DDAO signal intensities from CLSM files were normalized to total Cfp signal intensities to obtain an eDNA-to-biomass ratio. Black bars represent the mean values, with standard deviations displayed as error bars, obtained from two independent experiments conducted at least in duplicate. (D) Detection of phage λSo by immunoblot analysis in biofilms formed under hydrodynamic conditions on glass beads in the presence or absence of DFO. Sample normalization was achieved by adjusting cell suspensions to the same OD600 and analysis of stained SDS-PAGE gels (see Fig. S2 in the supplemental material). Representative immunoblot patterns from at least two independent experiments are presented. (E) Detection of phage λSo by immunoblot analysis in wild-type cells cultivated under planktonic growth conditions in the absence or presence of 20 μM Fe2+. The cells were harvested during logarithmic growth phase. Sample normalization was achieved by adjusting cell suspensions to the same OD600 and analysis of stained SDS-PAGE gels (see Fig. S2 in the supplemental material). Representative immunoblot patterns from at least two independent experiments are presented. (F and G) Detection of phage λSo by immunoblot analysis in biofilms formed by the wild type (F) and the Δfur deletion mutant (G) under static conditions in petri dishes in the presence of 20 μM and 100 μM Fe2+. Cell lysates of biofilm cells were subjected by SDS-PAGE followed by immunoblot analysis of major capsid protein SO_2963. Sample normalization was achieved by adjusting cell suspensions to the same OD600 and analysis of stained SDS-PAGE gels (see Fig. S2 in the supplemental material). Representative immunoblot patterns from at least two independent experiments are presented.

