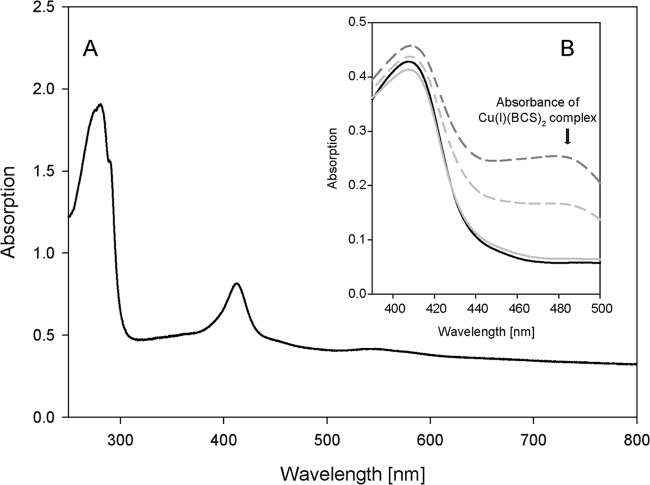
FIG 6.
UV-visible spectrum of purified Lcp1VH2 (A) and results of spectroscopic assays for determination of the oxidation state of copper within Lcp1VH2 by applying bathocuproine sulfonate (BCS) (B). For both panels, the buffer for all samples consisted of 20 mM sodium phosphate buffer containing 150 mM NaCl (pH 7.4). For panel B, All samples contained 50 μM Lcp1VH2 and 1% (wt/vol) SDS. The black solid line in panel B represents the absorption of all components, including 20 mM EDTA but excluding BCS. The light-gray broken line indicates a sample containing 500 μM BCS. The dark-gray broken line indicates a sample containing 500 μM BCS and 500 μM ascorbate. The light-gray solid line indicates a sample that contained 20 mM EDTA and 500 μM BCS.

