FIG 1.
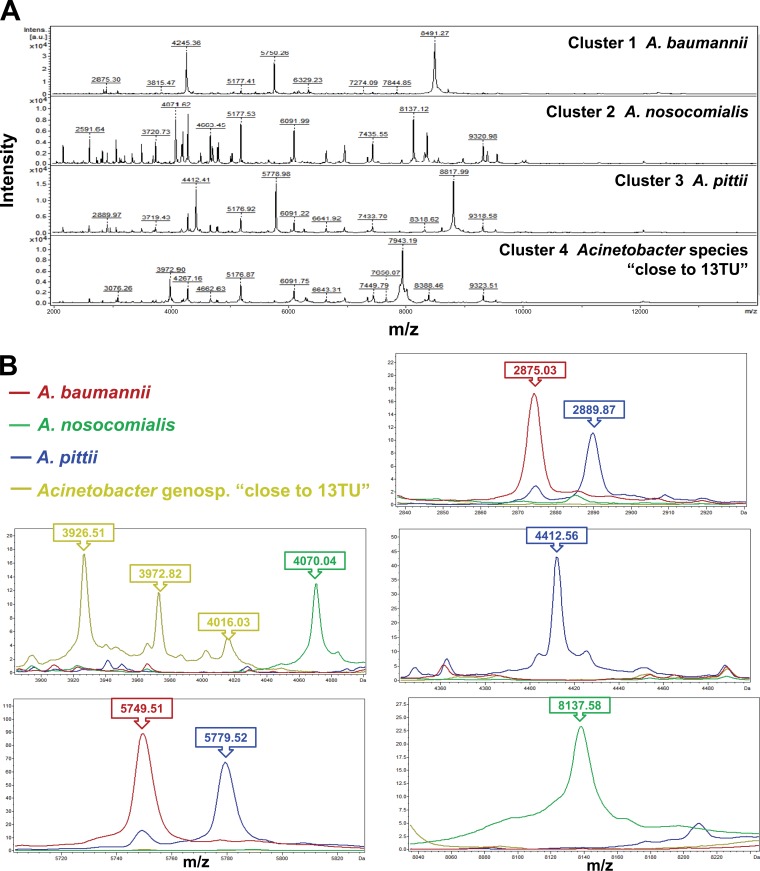
Cluster analysis of spectra generated by the MALDI-TOF Bruker Biotyper system for 286 A. baumannii complex (ACB complex) isolates. (A) Four clusters of spectra for ACB complex isolates, i.e., cluster 1 (A. baumannii), cluster 2 (A. nosocomialis), cluster 3 (A. pittii), and cluster 4 (Acinetobacter genospecies “close to 13TU”) were identified. (B) Clusters were based on the 10 peaks generated by ClinProTools with a genetic algorithm, i.e., 2875.03 m/z and 5749.51 m/z (A. baumannii)), 4070.04 m/z and 8137.58 m/z (A. nosocomialis); 2889.87 m/z, 4412.56 m/z, and 5779.52 m/z (A. pittii); and 3926.51 m/z, 3972.82 m/z, and 4016.03 m/z (Acinetobacter genospecies “close to 13TU”). The absolute intensities of the ions are shown on the y axis, and the masses (m/z) of the ions are shown on the x axis. The m/z values represent the mass-to-charge ratios.

