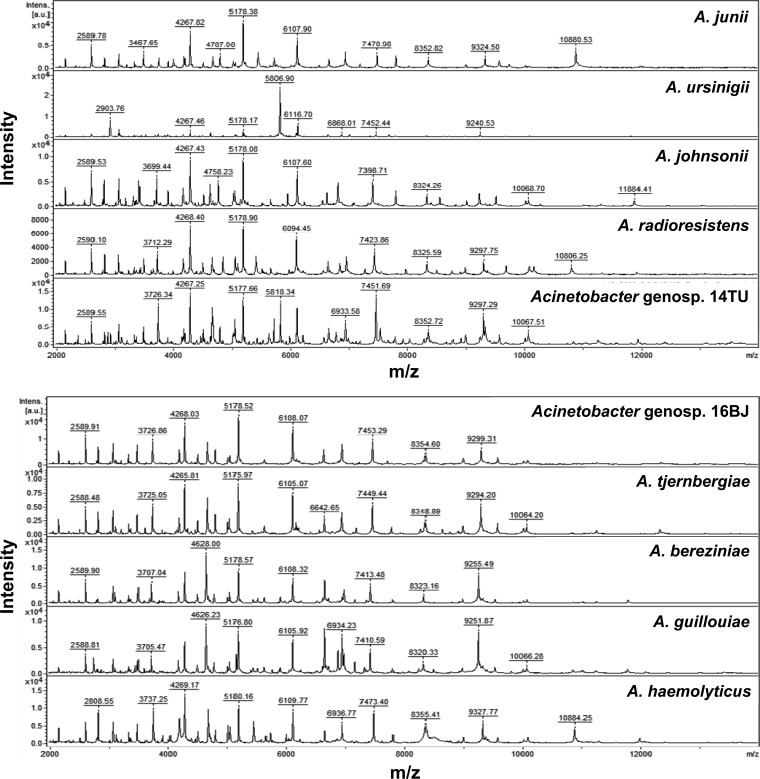
FIG 2.
Spectra of 10 species (genospecies) of Acinetobacter species other than ACB complex generated by the MALDI-TOF Bruker Biotyper system. The absolute intensities of the ions are shown on the y axis, and the masses (m/z) of the ions are shown on the x axis. The m/z values represent the mass-to-charge ratios.

