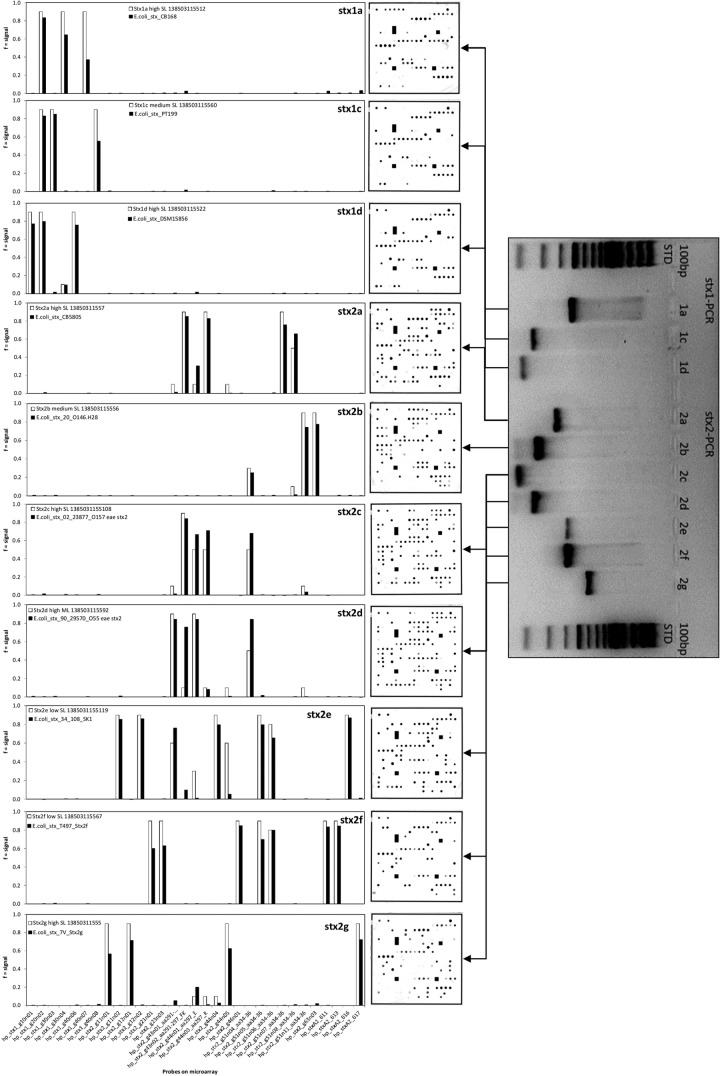
FIG 1.
Comparison between PCR and microarray results (microarray image and bar graph) of selected STEC reference strains. The white bars represent the expected hybridization values from theoretical experiments obtained from the matching of all array probes to the known sequence of all Stx alleles. The black bars represent experimental data under optimized and stringent hybridization conditions.

