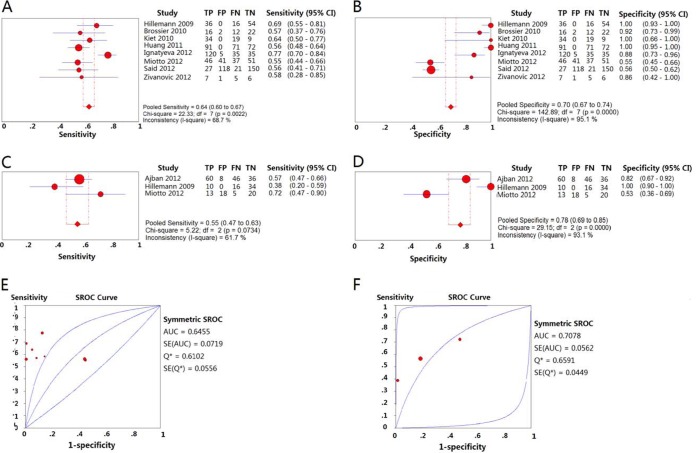
FIG 4.
Forest plots of the pooled sensitivity and specificity and SROC curve of GenoType MTBDRsl for detection of EMB drug susceptibility. Each solid circle indicates the point estimate of sensitivity and specificity from each study; the size of the solid circle indicates the size of each study. Both error bars and discontinuous lines indicate the 95% CI values. A diamond indicates the pooled sensitivity and specificity for all of the studies. The curve is the regression line that summarizes the overall diagnostic accuracy. (A) Sensitivity of GenoType MTBDRsl for the detection of EMB drug susceptibility in isolates; (B) specificity of GenoType MTBDRsl for the detection of EMB drug susceptibility in isolates; (C) sensitivity of GenoType MTBDRsl for the detection of EMB drug susceptibility in sputum specimens; (D) specificity of GenoType MTBDRsl for the detection of EMB drug susceptibility in sputum specimens; (E) SROC curve of GenoType MTBDRsl for the detection of EMB drug susceptibility in isolates; (F) SROC curve of GenoType MTBDRsl for the detection of EMB drug susceptibility in sputum specimens.

