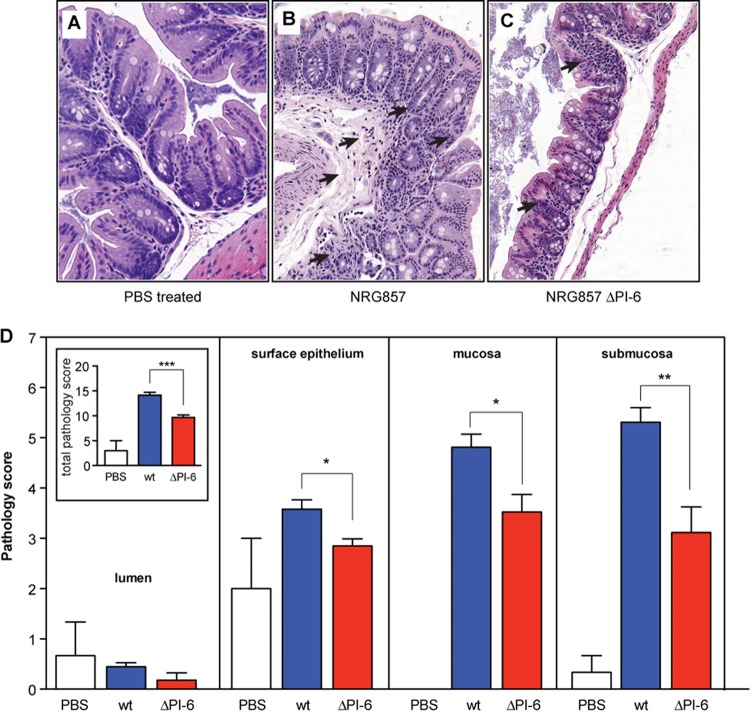
FIG 6.
PI-6 contributes to cecal pathology. CD-1 mice were infected for 30 days before the animals were sacrificed and the cecal tips were scored for histopathology. Images are representative of two experiments with five mice per group. (A) PBS-treated, uninfected controls; (B) NRG857c-infected mice; (C) NRG857ΔPI-6-infected mice. The black arrows in panels A to C indicate regions of submucosal edema, cellular infiltration, and hyperplasia. Original magnification, ×200. (D) Pathological scoring of the lumen, surface epithelium, mucosa and submucosa within the ceca of CD-1 mice. (Inset) Cumulative pathology score for the entire section. Values that are significantly different by Student's t test are indicated by bars and asterisks as follows: *, P < 0.05; **, P < 0.01. Scoring for each compartment represents an average of eight views per section, five mice per group, and from two experiments. Data are expressed as the means plus standard errors for each group.

