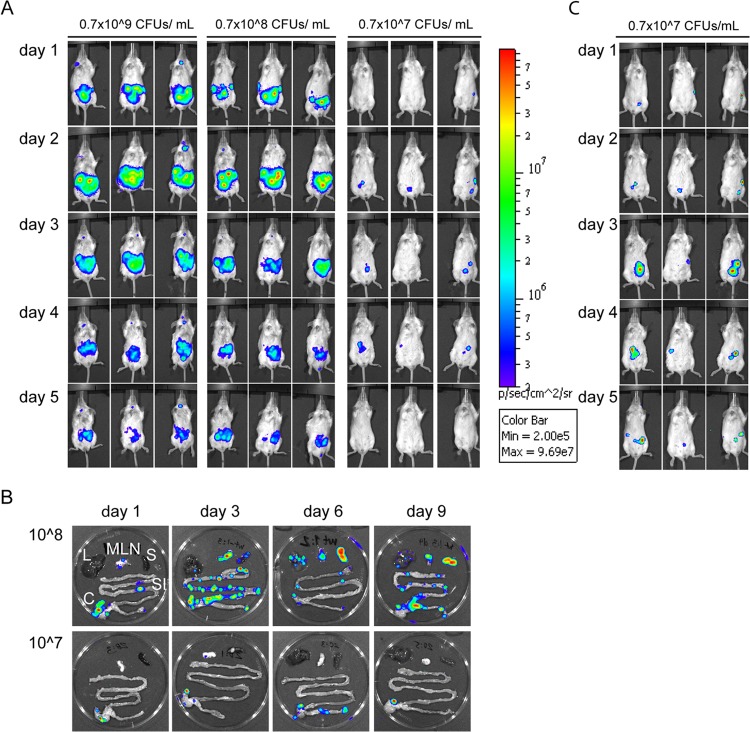
FIG 1.
Real-time monitoring of Y. pseudotuberculosis infection, using IVIS. (A) Mice were infected orally with 0.7 × 10⁹, 0.7 × 10⁸, or 0.7 × 10⁷ CFU/ml of overnight cultures of bacteria. The process of infection was monitored every day p.i. by detecting total photon emission, using the IVIS Spectrum system. The intensity of bioluminescent emission is represented as pseudocolors with variations in color representing light intensity; red represents the most intense light emission, while blue corresponds to the weakest signal. A common sensitivity scale is used for the different doses. (B) Spread of infection in organs during high-dose infection. SI, small intestine; C, cecum; MLN, mesenteric lymph nodes; S, spleen; L, liver. (C) Analysis of mice infected with 0.7 × 10⁷ CFU/ml (same mice as in panel A) on an individual scale for each image, allowing for detection of low signals.

