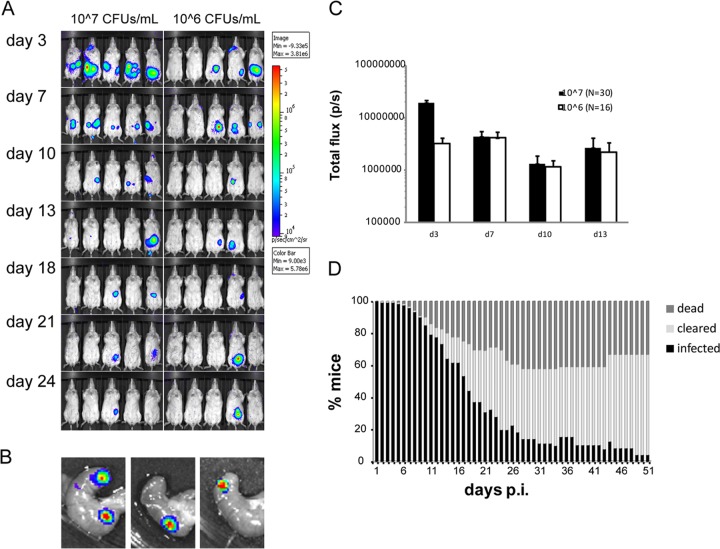
FIG 2.
Low-dose infection results in asymptomatic infection with localization in the cecum. (A) IVIS analysis of BALB/c mice infected with 106 or 107 CFU/ml in the drinking water. The figure shows representative groups from each infection dose. The intensity of bioluminescent emission is represented as pseudocolors with variations in color representing light intensity; red represents the most intense light emission, while blue corresponds to the weakest signal. A common sensitivity scale is used for the different doses. (B) IVIS analysis of ceca dissected from asymptomatic mice infected with Y. pseudotuberculosis on day 24 p.i. (C) Total flux (photons/s) in a defined region of interest of IVIS images from infected mice. Data are presented as means ± standard errors of the means. (D) Results of low-dose infection of Y. pseudotuberculosis in BALB/c (seven experiments, n = 120), showing the percentage of infected mice that succumbed to infection (dark gray), cleared infection (light gray), or maintained infection (black). Mice were defined as cleared or infected based on IVIS analyses. Note that the panel summarizes several independent infection experiments with different scheduled termination points that affect the total number of mice included in the calculation.

