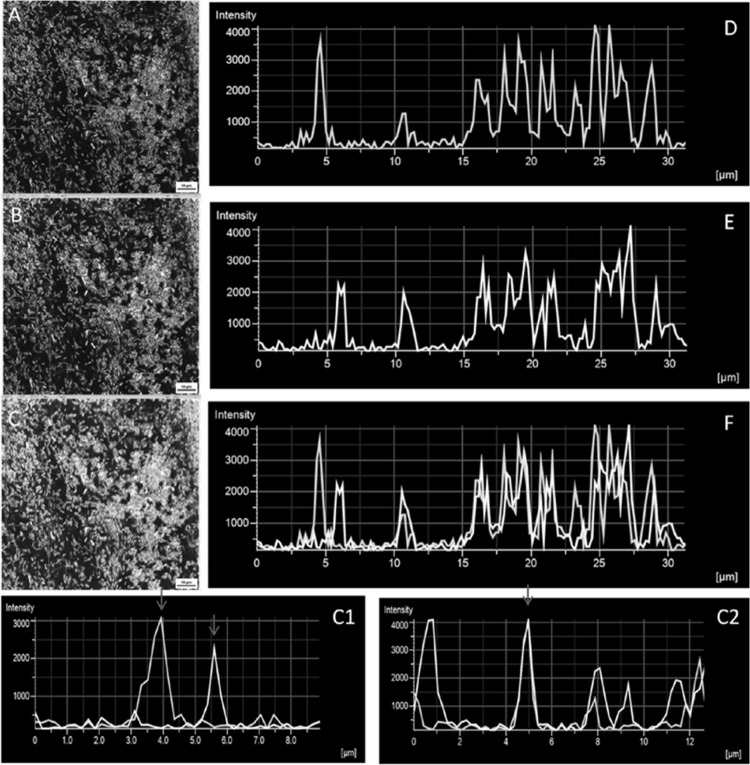
FIG 2.
(A to C) CLSM images of biofilms (cultured under batch conditions), formed on glass coverslips by (A) a GFP-tagged culture of A. baumannii M2, (B) a YFP-tagged culture of P. aeruginosa PAO1, and (C) cocultured A. baumannii M2 and P. aeruginosa PAO1. (D to F) Intensity graphs of fluorescence quantitated along the line indicated by arrows in the boxes in panels A, B, and C using NIS Elements viewer software. Highlighted area 1 in image C shows the two species in close proximity to each other (corresponding to the intensity graph in panel C1), and highlighted area 2 shows overlapping A. baumannii M2 and P. aeruginosa PAO1 cells (intensity graph in panel C2). Red arrows in panels C1 and C2 indicate intensity peaks. Magnification, ×63.

