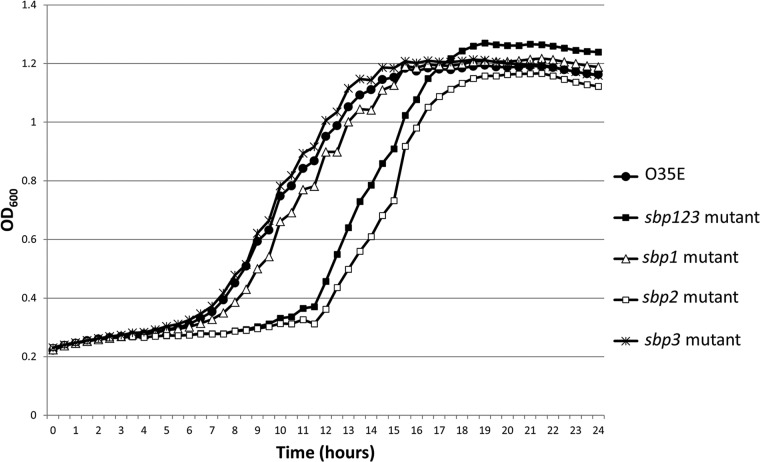
FIG 4.
Growth curve results of M. catarrhalis strain O35E and its sbp mutants. The x axis shows time (hours), and the y axis shows optical density at 600 nm. The sbp2 mutant and sbp123 mutant revealed a longer lag phase (11 to 12 h) than that of the wild-type strain O35E. The sbp1 and sbp3 mutants had growth characteristics similar to those of the wild-type strain. The peak optical density values are not significantly different between the wild-type strain and mutants.

