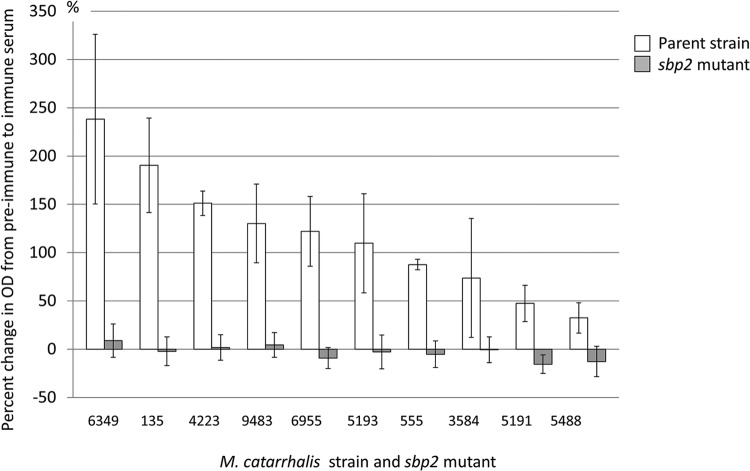
FIG 6.
Results of whole-cell ELISA with antiserum to SBP2 with acute otitis media strains and their sbp2 mutants. The x axis shows strain names; the y axis shows percent changes of ELISA values between preimmune and immune sera. White bars indicate the parent strain isolated from a patient with acute otitis media, and gray bars indicate the sbp2 mutant of the parent strain. Error bars indicate the standard deviations of results from three independent experiments. The percent changes of ELISA values among the 10 acute otitis media strains ranged from 238.3% (strain 6349) to 32.4% (strain 5488). Conversely, sbp2 mutants showed no significant change, with their ELISA values ranging from −15.5% to 8.9%.

