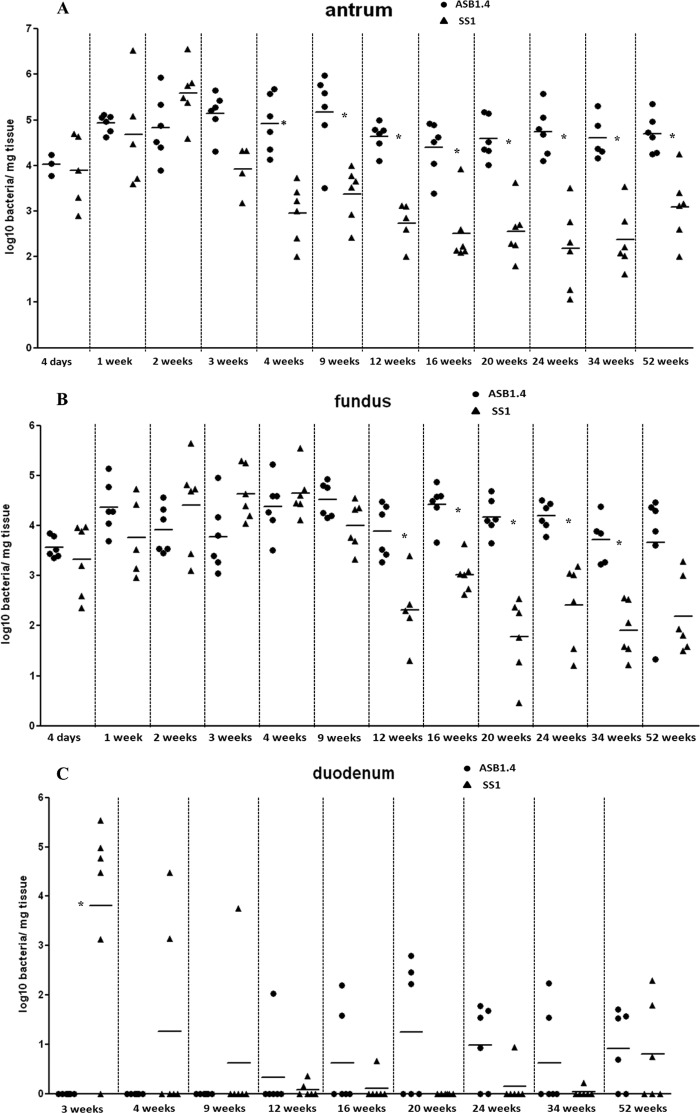
FIG 2.
Colonization capacity of H. heilmannii ASB1.4 and H. pylori SS1 after experimental infection. Colonization capacity is shown as log10 values of bacteria per mg tissue, detected with quantitative RT-PCR in the antrum (A) and the fundus (B) of the stomach and in the duodenum (C). Animals in which no Helicobacter DNA could be detected in the gastrointestinal tract were set as 0. Results for individual animals are depicted by symbols around the means (lines). Statistically significant differences between animals infected with H. heilmannii ASB1.4 and H. pylori SS1 are indicated (*, P < 0.05, Mann-Whitney U test).

