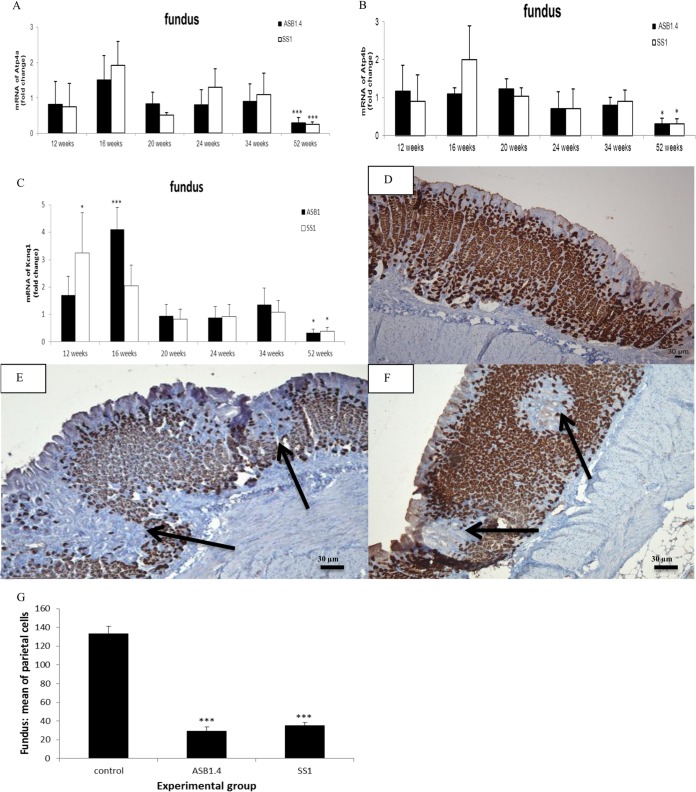
FIG 6.
Analysis of parietal cells in the fundus of the stomach of Helicobacter-infected and control mice. (A to C) Expression levels of Atp4a (A), Atp4b (B), and Kcnq1 (C) in the fundus of the stomach of H. heilmannii ASB1.4- and H. pylori SS1-infected mice are shown. Data are presented as fold changes in gene expression normalized to 3 reference genes and relative to the results for the negative-control group, which are set as 1. Significant differences in expression levels between the infected groups and the negative-control group at a certain time point (ANOVA) are indicated (*, P < 0.05; ***, P < 0.001). (D to F) Immunohistochemical staining for the hydrogen potassium ATPase. (D) ATPase staining of the fundus of a sham-inoculated mouse. (E and F) Loss of parietal cells (arrows) was seen in the fundus of the stomach of a mouse infected with H. heilmannii ASB1.4 for 52 weeks (bar = 30 μm). (G) The mean numbers of parietal cells in the fundus of the stomach from mice infected with Helicobacter for 52 weeks and control mice are shown. The number of parietal cells in each stomach was determined by counting ATPase-positive cells in 5 randomly chosen high-power fields at the level of the gastric pits. Significant differences between Helicobacter-infected and control animals (ANOVA) are indicated (***, P < 0.001).

