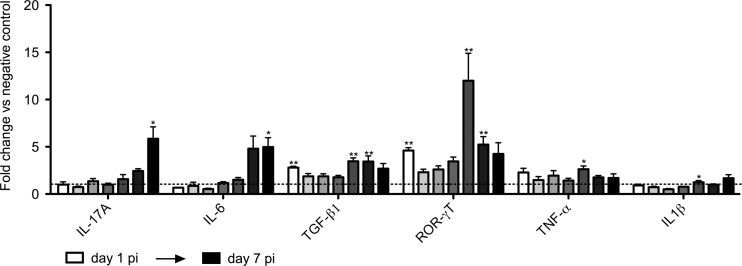
FIG 3.
Transcription profile of cytokines in the small intestines of G. muris-infected C57BL/6 mice during the first days postinfection. The transcription profile of cytokines was analyzed starting day 1 p.i. up to day 7 p.i. Mean fold changes in infected mice (n = 5) compared to uninfected controls are presented, and SEM are shown as error bars. Values that are significantly different are indicated by asterisks as follows: **, P < 0.01; *, P < 0.05.

