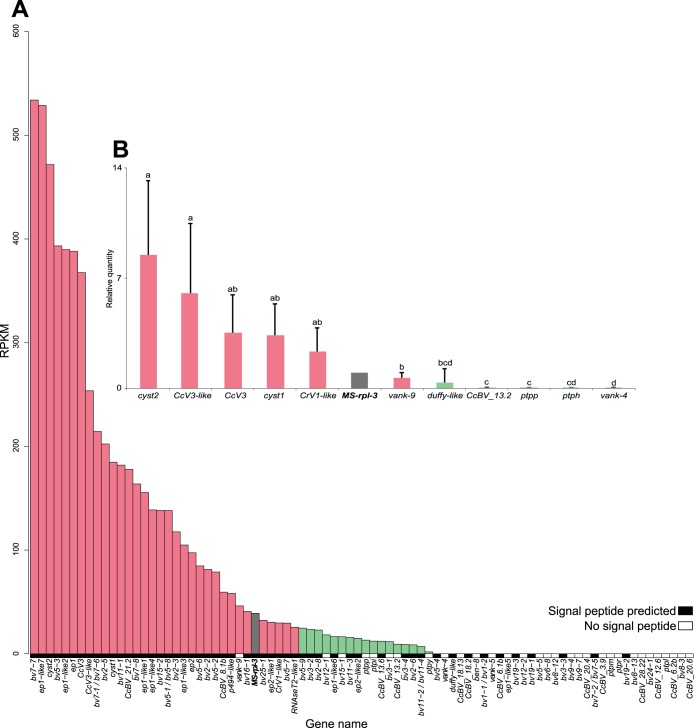
FIG 3.
Expression levels of CcBV genes in hemocytes of M. sexta larvae 24 h after parasitization by C. congregata. (A) RPKM values deduced from transcriptomic 454 sequencing for each CcBV gene detected in M. sexta hemocytes 24 h after parasitization. The M. sexta rpl3 gene was used as a reference (in gray). Genes encoding proteins with predicted signal peptides are symbolized by black boxes, whereas genes encoding potential intracellular proteins are indicated by white boxes. (B) Validation of expression levels by qRT-PCR analysis of 11 selected CcBV genes in new samples. Gene expression was measured in triplicate on samples from five independently parasitized individuals. The M. sexta rpl3 gene was used as a reference (in gray). Error bars indicate standard deviations, and different letters indicate significant differences in transcript abundance. Gene expression levels were separated into two categories based on the statistical differences between gene expression levels deduced from qRT-PCR analysis of new cDNA samples: high expression levels (red bars) (≥25 RPKM) and low expression levels (green bars) (<5 RPKM).

