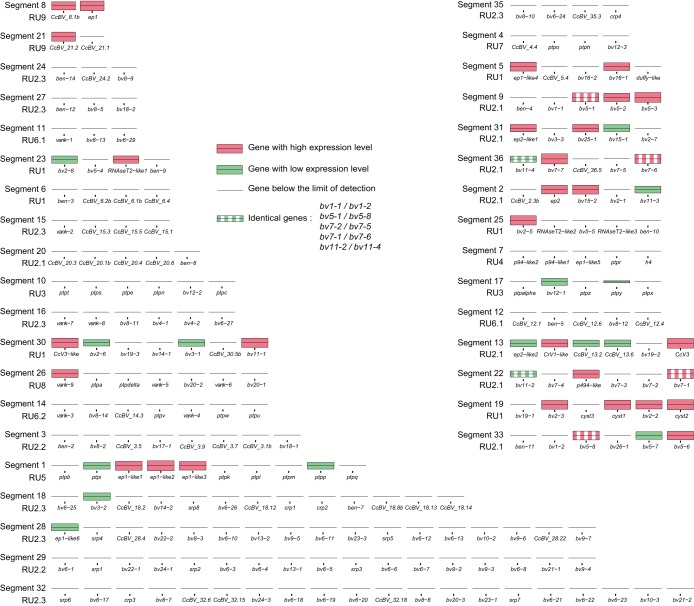
FIG 6.
Localization in CcBV segments of genes expressed in hemocytes. Each segment is represented by its predicted genes but is not to scale in terms of segment or gene length. Segment names and RU numbers are positioned to the right of each segment. Gene names are indicated below each bar. Expression levels are log normalized to facilitate visualization and are represented by colored bars.

