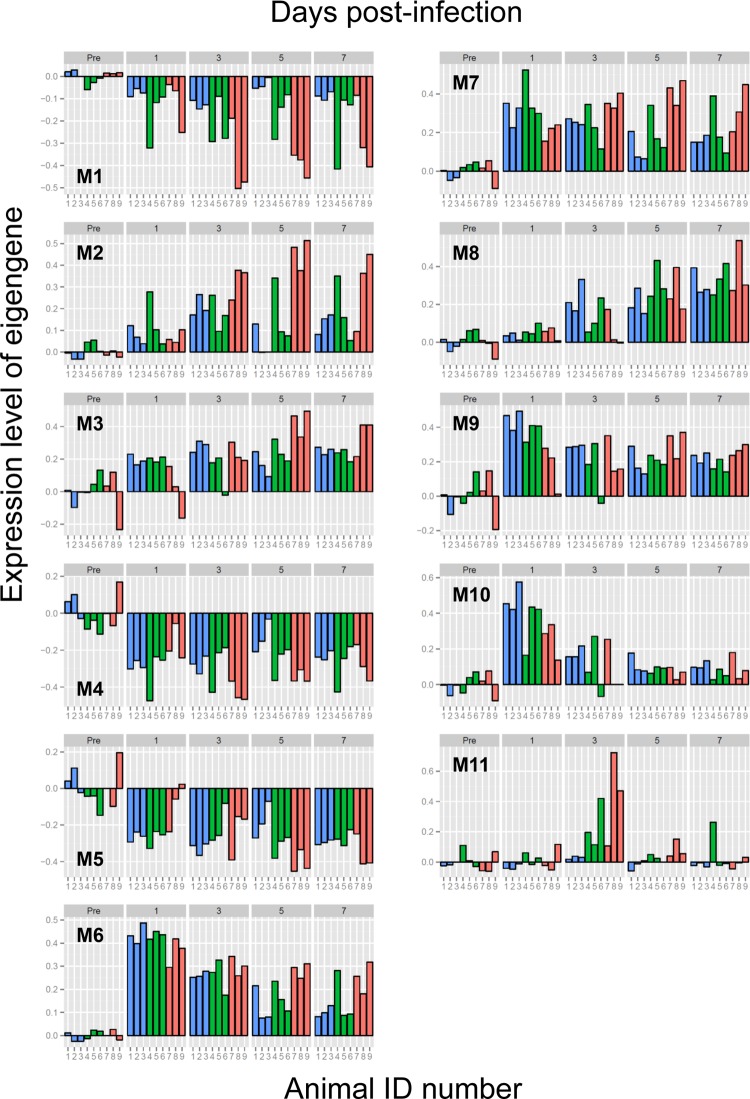
FIG 4.
Expression dynamics of 11 modules of genes representing host responses to H5N1 virus infection for each animal (M1 to M11). WGCNA was performed to identify modules of coexpressed genes. The 11 gene modules identified here were further analyzed for enriched GO categories as shown in Tables 5 and see Table S5 in the supplemental material. For each gene module, the expression levels of the eigengene for each sample are indicated by a colored bar: blue, VN3028IIcl3-infected animals; green, VN30259-infected animals; pink, and VN3040-infected animals. The time points for sample collection and the animal IDs (1 to 9) are indicated above and below the graph, respectively.

