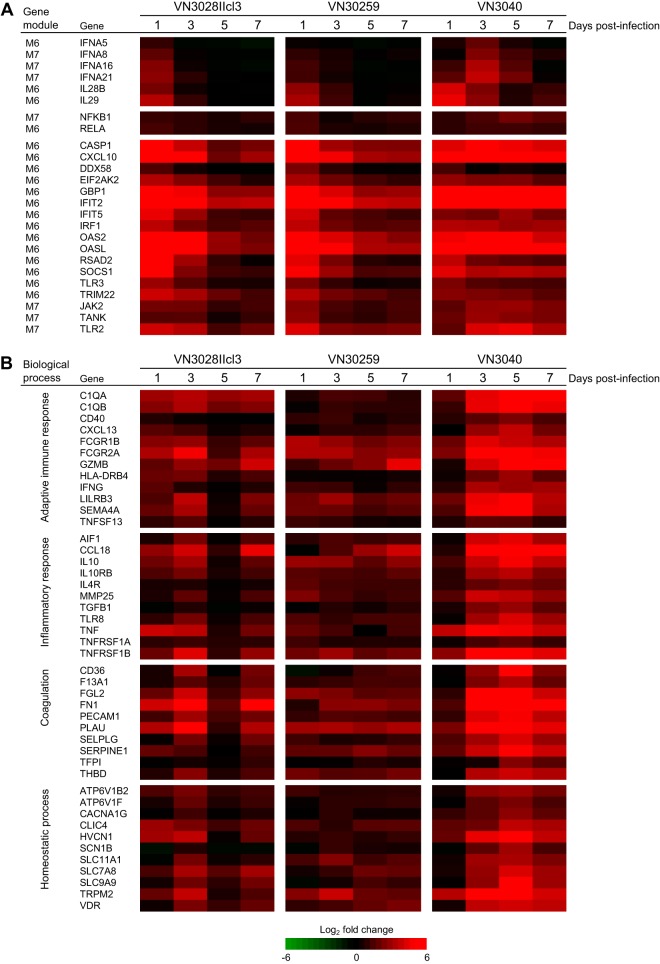
FIG 6.
Expression profiles of M6, M7, and M2 genes for each virus infection. (A) Type I and III interferon genes, the NF-κB genes, and representative ISGs, which belong to M6 or M7. (B) Representative M2 genes involved in the indicated biological process. Each column represents the mean log2-fold change among three animals for each virus infection, which is shown in red if it was upregulated relative to preinfection.

