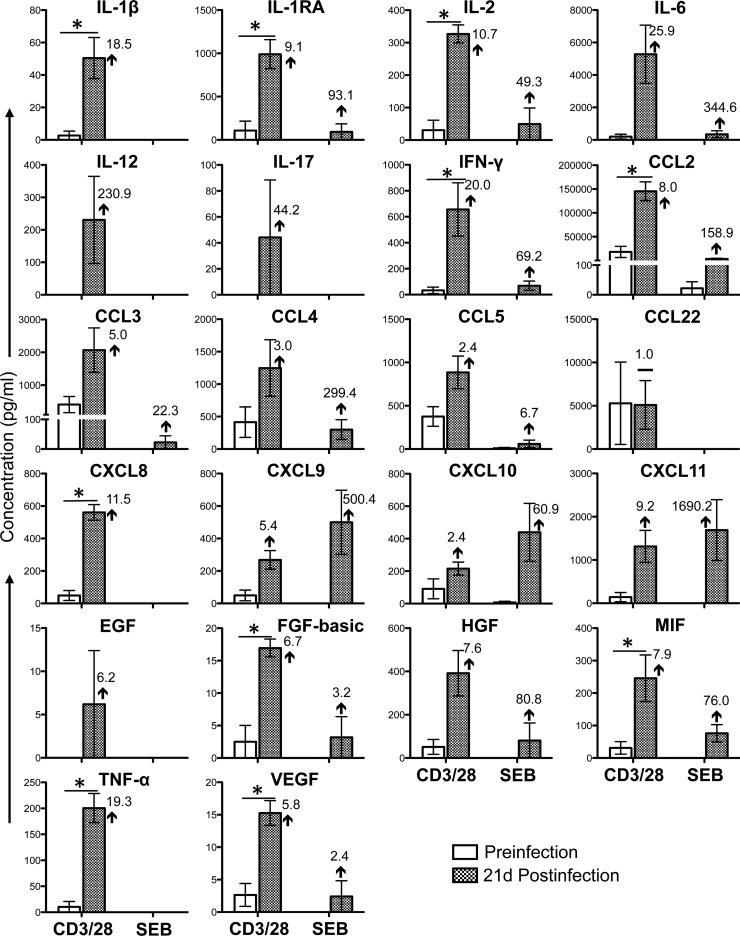
FIG 6.
Cytokine/chemokine profiles of BM CD3+ CD8+ T cells during the acute phase of SIVMAC251 infection. Bar graphs show 22 different cytokine-chemokine responses observed before and 21 days after SIV infection in culture supernatants from sorted SP CD8+ T cells stimulated with either anti-CD3/28 MAbs or SEB after subtraction of medium control values (n = 5). The value and arrow or line in each bar for the postinfection time point show the mean fold increase (upward arrow) or decrease (downward arrow) or no change (horizontal line) compared to the preinfection level. Asterisks indicate statistically significant differences from the preinfection levels in the respective cell populations (P < 0.05).

