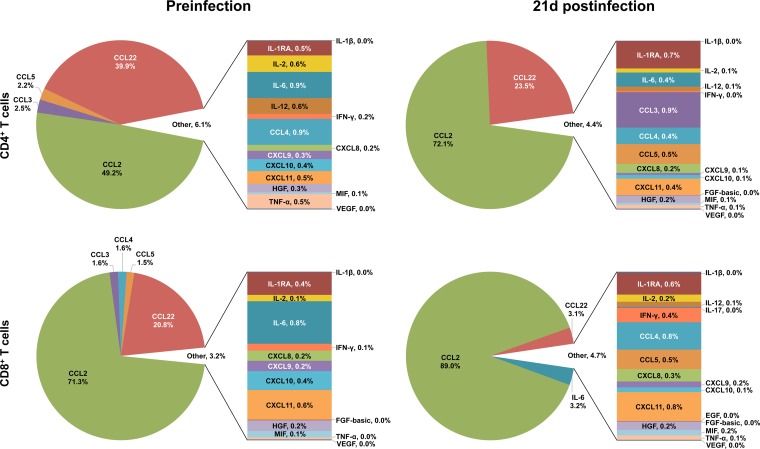
FIG 9.
Relative contributions of cytokine/chemokine expression in BM during the acute phase of SIVMAC251 infection. The pie charts illustrate the relative percent contributions of the cytokines/chemokines based upon their concentrations (pg/ml) in culture supernatants of sorted SP CD4+ and CD8+ T cells stimulated with anti-CD3/28 MAbs before and 21 days after SIV infection. Medium control values were subtracted from all values before analysis (n = 5). Cytokines/chemokines with contributions of <1% are shown in a bar graph and combined and designated “Other” in the pie chart for clarity. Cytokines/chemokines with overall contributions of 0.01 to 0.04% are represented by 0% in the pie chart.

